

How Much Energy Does a Solar Panel Produce?
In Los Angeles, a 400 W panel on a south-facing roof makes about 675 kWh a year — 1.85 kWh a day on average, from about 1.3 in December to 2.3 in August, by NREL’s PVWatts model. That is after realistic losses: the 400 W rating is a lab figure the panel rarely reaches on a roof. Inland cities make a little more, the coast a little less, and the same panel in Berlin makes about 40% less.
- Per panel: a 400 W panel makes about 675 kWh a year in LA, a 430 W about 725, a 460 W about 775.
- Per season: August produces about 1.7 times December.
- Per place: from 655 kWh in Santa Monica to 736 in Lancaster for a 400 W panel.
- Per direction: a west-facing panel makes about 87% of a south-facing one; north, about 69%.
The formula
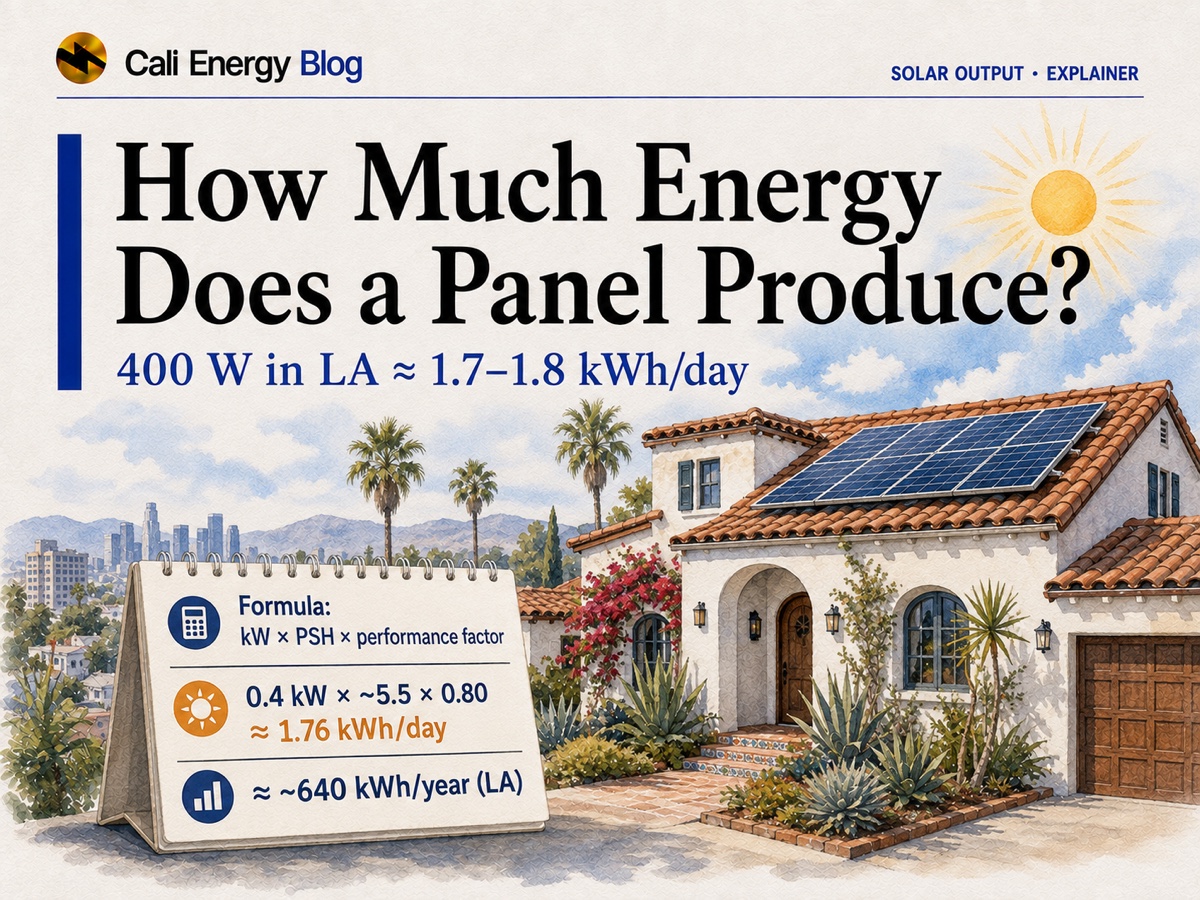
Daily kWh = panel kW × peak sun hours × performance factor. A peak sun hour is one hour of sunlight at the 1,000 W per square meter used to rate panels; a south-facing 20° roof in downtown LA gets about 6.0 of them a day. The performance factor covers everything between that sunlight and your meter. For a 400 W panel: 0.4 × 6.04 × 0.77 ≈ 1.85 kWh a day, which is what NREL’s full model gives. Many online calculators skip the last term and overstate output by a quarter or more.
Output by panel wattage in Los Angeles
| Panel | Per year | Per month (avg) | Per day (avg) |
|---|---|---|---|
| 400 W | 675 kWh | 56 kWh | 1.85 kWh |
| 430 W | 725 kWh | 60 kWh | 1.99 kWh |
| 460 W | 776 kWh | 65 kWh | 2.13 kWh |
Source: NREL PVWatts v8, 1,687 kWh per kW a year, 20° tilt, south, 14% losses; Cali Energy runs. The typical panel on LA homes in 2025 was 405 W; see solar panel types.
Month by month
| Month | Per month | Per day |
|---|---|---|
| January | 42 kWh | 1.3 kWh |
| February | 44 kWh | 1.6 kWh |
| March | 57 kWh | 1.8 kWh |
| April | 63 kWh | 2.1 kWh |
| May | 62 kWh | 2.0 kWh |
| June | 69 kWh | 2.3 kWh |
| July | 69 kWh | 2.2 kWh |
| August | 70 kWh | 2.3 kWh |
| September | 61 kWh | 2.0 kWh |
| October | 56 kWh | 1.8 kWh |
| November | 47 kWh | 1.6 kWh |
| December | 40 kWh | 1.3 kWh |
Source: NREL PVWatts v8 hourly run, Northridge, 20° south, typical weather year. Individual days vary; see cloudy and rainy days and solar at night.
Where you live
| Place | kWh per kW | 400 W panel |
|---|---|---|
| Santa Monica | 1638 | 655 kWh |
| Long Beach | 1686 | 674 kWh |
| Los Angeles (downtown) | 1687 | 675 kWh |
| Pasadena | 1693 | 677 kWh |
| Northridge | 1709 | 684 kWh |
| Santa Clarita | 1734 | 694 kWh |
| Lancaster | 1841 | 736 kWh |
| Phoenix | 1767 | 707 kWh |
| Denver | 1600 | 640 kWh |
| Chicago | 1308 | 523 kWh |
| Berlin (PVGIS) | 1011 | 404 kWh |
Sources: NREL PVWatts v8; Berlin from the European Commission’s PVGIS. Cali Energy runs; details in how much sun LA gets.
Which way it faces
| Facing | Share of south | Per year |
|---|---|---|
| South | 100% | 680 kWh |
| Southwest | 97% | 660 kWh |
| Southeast | 95% | 646 kWh |
| West | 87% | 592 kWh |
| East | 85% | 578 kWh |
| North | 69% | 469 kWh |
Source: NREL PVWatts v8 runs, as worked out in which way solar panels should face. Tilt matters less: 20° gives up under 2% against the best angle.
Where the rated watts go
A panel’s watt rating is measured at Standard Test Conditions: 1,000 W of light per square meter and a 25°C cell (DOE; see panel ratings and testing). On a roof, three sets of losses come off. NREL’s default system losses add up to 14%:
| Loss | Default |
|---|---|
| Soiling (dust, dirt) | 2% |
| Shading | 3% |
| Mismatch between panels | 2% |
| Wiring | 2% |
| Connections | 0.5% |
| Light-induced degradation | 1.5% |
| Nameplate rating | 1% |
| Availability (downtime) | 3% |
| Combined | 14% |
Source: NREL PVWatts calculator defaults (snow and age set to 0%) · PVWatts v8 documentation.
On top of those, the model applies the inverter’s efficiency (96% by default) and heat: cells on a summer roof run far above 25°C, which costs a Northridge array about 2–5.5% a month. See heat and solar output in LA and shade and trees.
Over the years
Panels lose output slowly: about 0.5% a year for a typical module, so the 675 kWh panel makes about 595 kWh in its 25th year. See solar panel degradation.
From one panel to a whole home
Divide your yearly use by a panel’s yearly output: an average California home at about 6,040 kWh needs about nine 400 W panels in LA. See how many solar panels you need. For your own roof, run your address in PVWatts.
Frequently asked
How much electricity does a solar panel produce per day?
In Los Angeles, a 400 W south-facing panel averages about 1.85 kWh a day: around 1.3 in December and 2.3 in August, by NREL’s PVWatts model.
How much energy does a solar panel produce per year?
About 675 kWh for a 400 W panel in downtown LA, 725 for 430 W and 775 for 460 W; roughly 655 on the coast and 736 in the Antelope Valley.
What are peak sun hours?
The day’s sunlight expressed as hours at 1,000 W per square meter, the intensity panels are rated at. A south-facing 20° roof in Los Angeles gets about 6.0 a day on average.
Why is a panel’s real output less than its watt rating?
The rating is a lab figure. On a roof, NREL assumes 14% of system losses (dirt, shade, wiring, downtime and more), plus inverter losses and heat, which together leave about 77% of the rating times the peak sun hours.
Does the direction a panel faces change its output?
Yes. In Northridge, southwest makes about 97% of south, west 87%, east 85% and north 69%.
How much does a solar panel make in winter?
About 40 kWh in December for a 400 W panel in Northridge, against 70 in August.
How do I calculate my own panel’s output?
Multiply the panel’s kW by your peak sun hours and about 0.77, or run your address, tilt and direction in NREL’s free PVWatts calculator.
Related reading
Sources & methodology
Figures on this page come from the primary sources below and, where noted, from Cali Energy calculations using the stated assumptions. Rates, incentives, and program terms change; each was verified October 6, 2026.
About this guide
An educational reference from Cali Energy’s research team, built on NREL’s public model. For a figure for your own roof, run your address in PVWatts.
Prepared by Cali Energy, October 6, 2026. This article is for general educational purposes only and is not legal, tax, financial, engineering, or utility advice. Rates, incentives, codes, permit requirements, equipment specifications, prices, and program terms may change; figures and timelines are estimates, not guarantees. Confirm current requirements with the applicable utility, AHJ, program administrator, manufacturer, or a licensed professional. See our Content Disclaimer. Cali Energy · 19201 Parthenia St, Unit E, Northridge, CA 91324 · CSLB #1032379 (B, C-10, C-39)