

How Much Sun Does LA Really Get? The Data
Straight answer: a south-facing roof at a 20° pitch in Los Angeles receives about 6.0 peak sun hours a day, and each kilowatt of panels on it produces about 1,690 kWh a year, by NREL’s PVWatts. That is about 1.7 times what the same panels make in Berlin, and close to Phoenix. Inland is sunnier than the coast, and December makes about 40% less than August. Below: city by city, month by month, from our own runs of the public tools.
Get a free estimate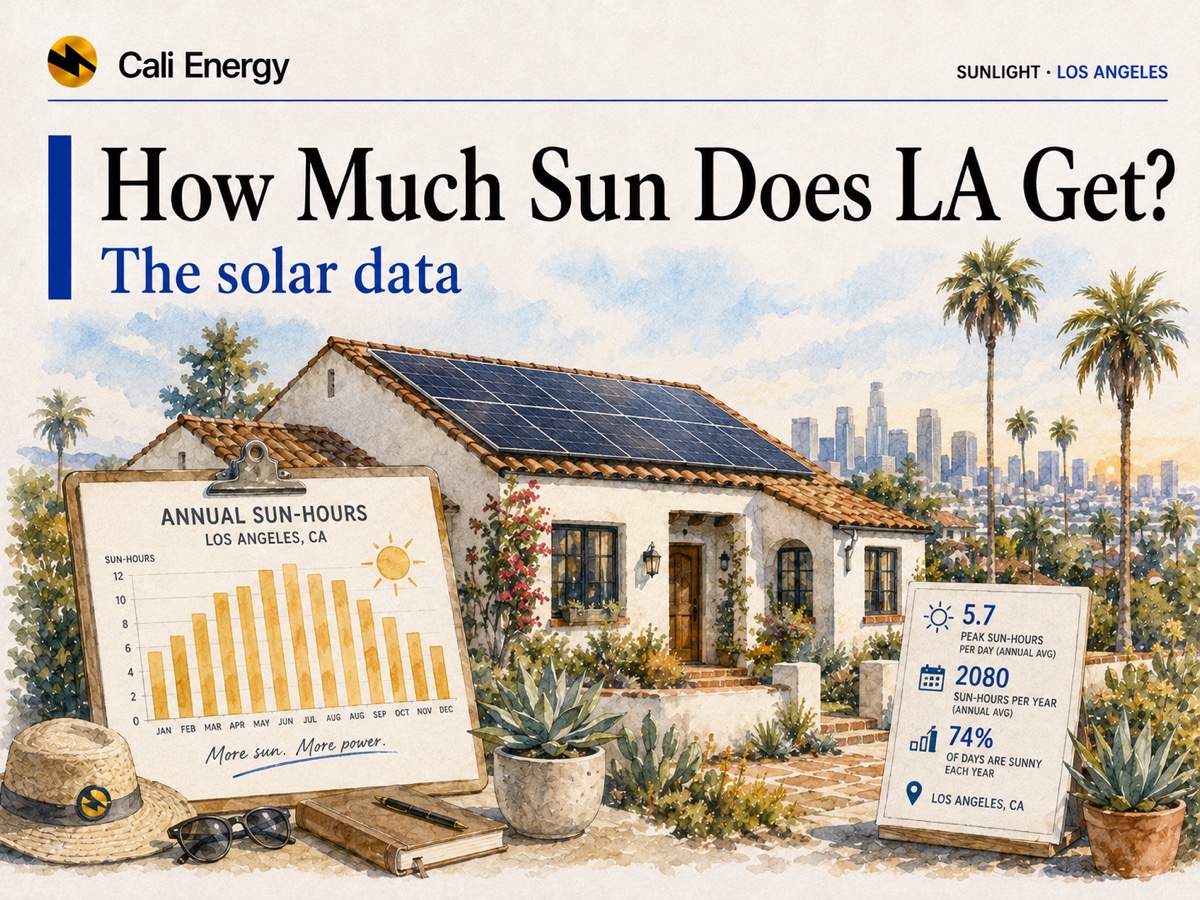
- LA basin: 5.8–6.1 peak sun hours a day and 1,640–1,710 kWh per kW a year, from Santa Monica to Northridge.
- Inland gets more: Santa Clarita about 1,730 and Lancaster about 1,840 kWh per kW, more than Phoenix’s 1,770.
- Against Germany: 1,680 kWh per kW for LA versus 1,010 for Berlin and 1,080 for Munich in the EU’s own tool — about 1.6–1.7 times as much.
- Seasons: August produces about 1.7 times December. Coastal June gloom shows up as a dip in Santa Monica’s June.
- Sun is rarely the limit in LA: roof direction, shade and your utility’s rules decide the result.
What a peak sun hour means
A peak sun hour is one kilowatt-hour of sunlight per square meter — an hour of full midday sun at 1,000 watts per square meter. Six peak sun hours means the panel surface receives as much energy over the day as six hours of full sun would deliver. The figures here are measured on the plane of the panels, a 20° roof facing due south, because that is what the panels actually see; numbers for flat ground are lower. Output per kilowatt converts that sunlight into electricity after typical losses for heat, wiring, inverter and soiling, which PVWatts sets at 14% (NREL PVWatts, weather from the National Solar Radiation Database).
The numbers, city by city
Inland valleys beat the coast.
| City | Peak sun hours a day | kWh per kW a year |
|---|---|---|
| Santa Monica | 5.8 | 1,640 |
| Long Beach | 6.0 | 1,690 |
| Los Angeles (downtown) | 6.0 | 1,690 |
| Pasadena | 6.1 | 1,690 |
| Northridge | 6.1 | 1,710 |
| Santa Clarita | 6.3 | 1,730 |
| Lancaster | 6.7 | 1,840 |
Source: Cali Energy runs of NREL PVWatts (version 8, NSRDB typical-year weather) for each city center, October 2026. A real roof differs with its direction, tilt and shade.
The spread inside the basin is small — about 4% between Santa Monica and Northridge — while the high desert stands out: Lancaster gets about 9% more than downtown. For a home system, the city matters less than whether the roof faces south or west; see east-west vs south-facing solar.
LA against the rest
Close to Phoenix, far above Germany.
| City | Tool | Peak sun hours a day | kWh per kW a year |
|---|---|---|---|
| Los Angeles (downtown) | PVWatts | 6.0 | 1,690 |
| Phoenix | PVWatts | 6.5 | 1,770 |
| Denver | PVWatts | 5.6 | 1,600 |
| Chicago | PVWatts | 4.5 | 1,310 |
| Los Angeles (downtown) | PVGIS | 6.0 | 1,680 |
| Munich | PVGIS | 3.7 | 1,080 |
| Berlin | PVGIS | 3.5 | 1,010 |
Sources: Cali Energy runs of NREL PVWatts for the US cities and of the European Commission’s PVGIS 5.2 for Germany and, for a like-for-like check, Los Angeles. The two tools use different weather data, so compare within each tool.
Germany built one of the world’s largest solar markets on about 1,000–1,100 kWh per kW. The same panels in Los Angeles make about 1.6–1.7 times as much. Within the US, LA sits between Denver and Phoenix, and well above Chicago.
Month by month
August is the peak, December the low, and the coast has June gloom.
| Month | Downtown peak sun hours a day | Downtown kWh per kW | Santa Monica kWh per kW |
|---|---|---|---|
| Jan | 4.4 | 110 | 104 |
| Feb | 5.0 | 110 | 113 |
| Mar | 5.9 | 141 | 145 |
| Apr | 6.8 | 156 | 154 |
| May | 6.6 | 154 | 162 |
| Jun | 7.3 | 164 | 152 |
| Jul | 7.5 | 172 | 165 |
| Aug | 7.6 | 174 | 166 |
| Sep | 6.8 | 153 | 139 |
| Oct | 5.7 | 135 | 135 |
| Nov | 5.0 | 116 | 104 |
| Dec | 4.0 | 100 | 98 |
Source: Cali Energy runs of NREL PVWatts, 20° south-facing, 14% losses.
Downtown, August produces about 174 kWh per kW and December about 100, so the best month makes roughly 1.7 times the worst. Santa Monica’s June falls below its May — the marine layer that locals call June gloom — while downtown dips in May instead. Because net-metering and billing periods run over months or a year, the winter dip mostly matters for sizing and for batteries; see solar panels in winter.
What a 400 W panel makes downtown
On the same 20° south-facing roof, a single 400-watt panel makes about 675 kWh a year, or 56 kWh a month on average — about 40 kWh in December and 70 in August (Cali Energy calculation from the PVWatts runs above). To run your own numbers, use the panel output estimator or the sun-hours calculator; the details are in how much energy a solar panel produces.
What this means for an LA homeowner
Sun is not the limit
Every LA-area city here gets more sun than Denver. Shade, roof direction and space decide more than the city does.
Size from your bill
Divide your yearly use by about 1,700 kWh per kW for a rough system size; see how many solar panels you need.
Heat costs a little
Panels lose some efficiency in hot weather, already inside the 14% losses; see heat and solar output.
Your utility sets the value
The same kilowatt-hour is worth different money on SCE and LADWP; see is solar worth it.
Where to go next
Cali Energy is a licensed Los Angeles solar, battery and electrical contractor (CSLB #1032379). We model your own roof — its direction, tilt and shade — rather than a city average. Call +1-323-844-7777 or get a roof-specific estimate.
Frequently asked
How many peak sun hours does Los Angeles get?
About 6.0 a day on a 20° south-facing roof downtown, by NREL’s PVWatts; 5.8 in Santa Monica, 6.1 in Northridge and 6.7 in Lancaster. The figure is sunlight on the plane of the panels, averaged over the year.
Does LA really get more sun than Germany?
Yes. In the European Commission’s PVGIS, with the same panels and assumptions, Los Angeles produces about 1,680 kWh per kW a year, Munich about 1,080 and Berlin about 1,010 — 1.6 to 1.7 times as much.
How much power will 1 kW of panels make in LA?
About 1,640–1,710 kWh a year in the LA basin on a south-facing 20° roof after 14% losses, and about 1,730–1,840 in Santa Clarita and the Antelope Valley. East- or west-facing roofs make less.
Do the seasons change how much solar I get?
Yes, but less than in most of the country. Downtown, August produces about 174 kWh per kW and December about 100. Coastal cities also see a June dip from the marine layer.
If LA is so sunny, is solar automatically worth it?
No. Sunlight is rarely the limit; your roof, shade, usage and especially your utility’s rules for exported power decide the return.
Related reading
Sources & methodology
Figures on this page come from the primary sources below and, where noted, from Cali Energy calculations using the stated assumptions. Rates, incentives, and program terms change; each was verified October 5, 2026.
Sun isn’t the question — your roof is
Send us your address and a recent bill and we’ll model your roof’s direction, tilt and shade, not a city average. Estimates, not guarantees.
Get a free estimatePrepared by Cali Energy, October 5, 2026. This article is for general educational purposes only and is not legal, tax, financial, engineering, or utility advice. Rates, incentives, codes, permit requirements, equipment specifications, prices, and program terms may change; figures and timelines are estimates, not guarantees. Confirm current requirements with the applicable utility, AHJ, program administrator, manufacturer, or a licensed professional. See our Content Disclaimer. Cali Energy · 19201 Parthenia St, Unit E, Northridge, CA 91324 · CSLB #1032379 (B, C-10, C-39)