

Solar Panel Degradation: How Much Power Do Panels Lose Over Time?
Straight answer: slowly, but a little faster than the famous “0.5% a year” suggests. That figure is the median for individual modules in the national laboratory’s review of more than 11,000 measurements. Measured across whole systems, US fleets lose about 0.75% a year, and a study of home rooftops found 1.3% a year of lost energy yield — a figure that includes dirt and growing shade. Current premium panel warranties promise 89–92% of rated power at year 25. Below: what each number means, what year 25 looks like, and how to tell whether your own system is declining normally.
Get a free estimate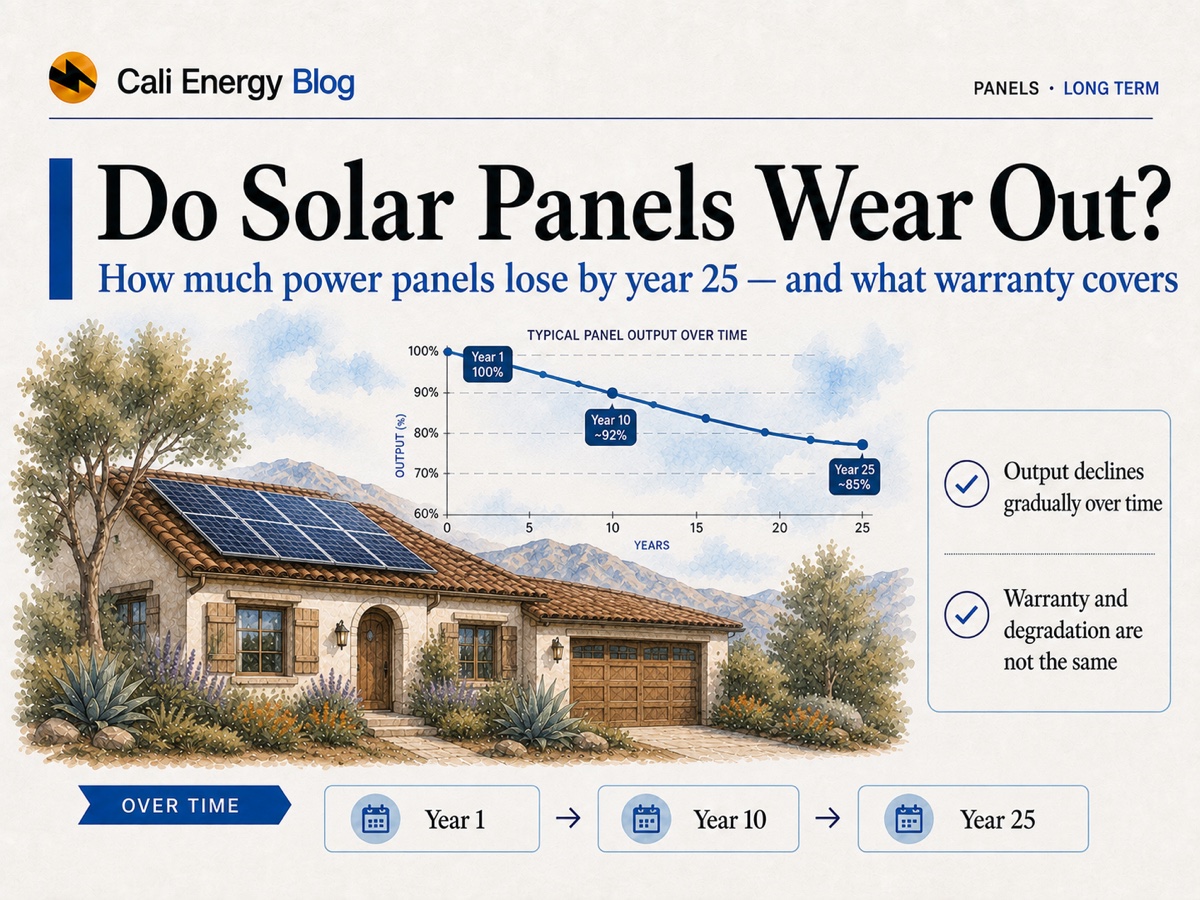
- Panels don’t stop at 25 years; they make a little less each year. Warranties allow about 1–2% in the first year, then a slow annual decline.
- Three measured rates get mixed up: 0.5%/yr for modules (median), 0.75%/yr for whole systems in the US fleet, and 1.3%/yr of energy yield on home rooftops, where dirt, shade and inverter losses count too.
- At 0.5% a year a system keeps about 88% of its output at year 25; at 0.75%, about 83%. Warranties guarantee the panels themselves 89–92% at year 25 on current premium models.
- The newest panel type, TOPCon, has early field data only: the national lab measured a 1.3–1.8% first-year loss and, with high uncertainty, a median of 1.1% a year over the short record.
- If your system loses much more than the home-rooftop median of 1.3% a year, look for a fixable cause — dirt, new shade or a failed component — before a panel warranty claim.
Three degradation numbers, three different things
Most confusion comes from quoting a module number for a whole rooftop system.
Modules: about 0.5% a year. The national laboratory (formerly NREL) compiled more than 11,000 degradation rates from about 200 studies in 40 countries. For crystalline silicon the median is about 0.5% a year and the mean 0.8–0.9%; the average sits higher because a minority of cases degrade much faster. The data associate hotter climates and hotter-running modules with faster degradation (Compendium of PV Degradation Rates; analytical review).
Whole systems: about 0.75% a year. The laboratory’s PV Fleet study measured performance loss on 4,915 inverters across US fleets and found a median of 0.75% a year, which it describes as an updated system value rather than 0.5% (PV Fleet final report, 2025). The same program puts typical annual soiling losses at 2–3%, and up to 15% at dirtier sites.
Home rooftops: about 1.3% a year of energy yield. A study of 503 systems, 387 of them residential, found a median residential energy-yield decline of 1.3% a year, and 2.1% where shade was medium or heavy. That is a whole-system number — growing trees, dirt and inverter losses included — and its authors caution against reading it as panel decline (Deceglie et al.).
What year 10, 25 and 30 look like
Each measured rate applied year after year from new, next to three current warranty schedules, which are straight-line guarantees for the panels alone.
| Basis | Rate | Year 10 | Year 25 | Year 30 |
|---|---|---|---|---|
| Modules, median (national lab review) | 0.5%/yr | 95.1% | 88.2% | 86.0% |
| Whole systems, US fleet median | 0.75%/yr | 92.7% | 82.8% | 79.8% |
| Crystalline modules, mean | 0.85%/yr | 91.8% | 80.8% | 77.4% |
| Home rooftops, energy yield (median) | 1.3%/yr | 87.7% | 72.1% | 67.5% |
| Warranty: Maxeon, registered | 98% yr 1, then 0.25% | 95.75% | 92.0% | 90.75% |
| Warranty: Silfab Prime QD | 98% yr 1, then 0.30% | 95.3% | 90.8% | 89.3% |
| Warranty: Canadian Solar TOPHiKu6 | 99% yr 1, then 0.4% | 95.4% | 89.4% | 87.4% |
Our calculation from the rates in the Compendium, the PV Fleet report and Deceglie et al., and the schedules in the Maxeon, Silfab and Canadian Solar warranties. Qcells warrants the Q.TRON BLK M-G2+ to at least 90.58% and REC the Alpha Pure-RX to at least 92% at year 25.
Two things stand out. The warranty floors sit above the measured system and rooftop rates, because a warranty covers the panel’s own power, measured under standard test conditions, while your meter also sees dirt, shade, heat and the inverter. And none of the lines hits zero: a panel at year 30 still makes most of its original power, which is why systems are planned around 25–35-year lives.
What a panel warranty actually promises
There are two warranties, and the conditions matter as much as the years.
| Panel | Product warranty | Performance guarantee |
|---|---|---|
| Maxeon | 40 years if registered within 6 months and installed by an authorized installer; otherwise 25 | 98% in year 1, −0.25%/yr, 88.25% at year 40 (92% at year 25 if not registered) |
| REC Alpha Pure-RX | 20 years; 25 with an REC Certified Solar Professional | At least 92% at year 25 |
| Qcells Q.TRON BLK M-G2+ | 25 years | At least 90.58% at year 25 |
| Silfab Prime QD | 12 years, extendable to 25 through a registered Silfab installer | 98% in year 1, then no more than 0.30%/yr to year 30 (89.3%) |
| Canadian Solar TOPHiKu6 | 12 years; 25 only for rooftop installs in certain regions | No more than 1% in year 1, then 0.4%/yr to year 30 |
The performance guarantee is the one about degradation: if the panel’s tested power falls below the schedule, it is a claim. The product warranty covers defects that make the panel fail. Several of the longest terms depend on registration or on a certified installer, so ask which terms apply to your install, in writing. How these fit with the inverter, workmanship and battery warranties is in solar warranties explained, and the full panel comparison in the best solar panels for California.
New panel types: what the 2026 field data show
Many panels sold in 2026 use newer TOPCon cells, which typically carry 30-year warranties at 0.4% a year after a 1% first year. Their field record is still short. In a July 2026 presentation the national laboratory reported a first-year loss of 1.3–1.8% on TOPCon modules from two makers at its test sites — within warranty expectations — and, across the TOPCon data it analyzed, a median of 1.1% a year, close to the 1% it measured on bifacial PERC modules. It flagged high uncertainty (short records, partly residential data) and a measurement effect that can make TOPCon modules test lower after sitting in the dark, and concluded that new module types can bring new degradation mechanisms and need more monitoring. The same study found the TOPCon modules ran 1.7°C cooler than PERC side by side, with a 2.2% higher performance ratio (NLR, 2026).
The data come largely from bifacial test modules, not the typical home panel, so they don’t settle the question — but they are a reason to weigh the warranty and the company behind it, not only the headline degradation rate.
Is my system declining normally? A worked check
Example: an eight-year-old Valley system made 12% less this year than in its first full year.
Seven years of decline at each measured rate would explain: 3.4% at the module median, 5.1% at the US fleet median, 8.8% at the home-rooftop median, and 13.8% on rooftops with medium or heavy shade. The warranty schedules allow even less decline for the panels alone — 1.8–2.8% over the same years on the three above. So a 12% drop is more than typical aging. Work through the usual causes before blaming the panels:
- Weather. Compare the same months across several years; one cloudy spring can move a year’s total.
- Dirt. Soiling commonly costs 2–3% a year and much more at dusty sites, and a wash recovers it — see solar panel cleaning in California.
- New shade. Trees grow; the rooftop study’s shaded homes lost 2.1% a year. See solar and shade.
- Equipment. A failed microinverter or optimizer shows up as one panel at zero in your monitoring app, a failed string inverter as the whole system — see solar not producing.
- Then the panels. A performance-warranty claim rests on the panel’s tested power against its schedule, so ask your installer to test suspect modules before filing.
What speeds degradation up
Heat
Hotter climates and hotter-running modules go with faster degradation in the national lab’s data. That is separate from heat’s day-to-day output loss, covered in how heat affects solar output in LA. An air gap under the panels helps with both.
Stress over the years
The laboratory’s accelerated tests use the stressors that age panels: thermal cycling, heat, moisture, mechanical loading, system voltage and ultraviolet light (NLR). Careful handling and a sound install limit the mechanical ones.
Shade and dirt
Not panel degradation, but they cut output the same way and grow over time. Dirt washes off; a trimmed tree gives production back.
New cell designs
Newer module types can bring new degradation mechanisms, such as ultraviolet-induced loss, which is why the laboratory is still monitoring them.
Your inverter usually wears out first
Panels are the long-lived part. A SolarEdge Home Hub inverter carries a 12-year standard warranty and Enphase microinverters 25 years, so plan the long-term budget around the inverter — see Enphase vs SolarEdge and solar inverter replacement.
Cali Energy (CSLB #1032379) designs and installs solar across Los Angeles and the San Fernando Valley. We can recommend panels whose warranty terms hold up on your roof, or look at your monitoring data to tell normal decline from a fixable problem.
Ask us which panels hold up best on your roofFrequently asked
How much power do solar panels lose each year?
It depends on what is measured. Modules: a median of about 0.5% a year, mean 0.8–0.9%, in the national laboratory’s review of 11,000+ measurements. Whole systems: a median of 0.75% a year across US fleets. Home rooftops: 1.3% a year of energy yield, including dirt, shade and inverter losses. Warranties allow about 1–2% in the first year, then 0.25–0.4% a year on current premium panels.
Will my solar panels still work after 25 years?
Yes. At 0.5% a year a system keeps about 88% of its output at year 25, and about 83% at 0.75%. Current premium warranties guarantee the panels themselves 89–92% at year 25, and several run to 30 or 40 years. Panels keep producing after the warranty ends; the decline is gradual, not a cliff.
What is the difference between a product warranty and a performance warranty?
The product warranty covers defects that make a panel fail — 12 to 40 years on current models, often longer only with registration or a certified installer. The performance warranty guarantees minimum power over time, such as 98% in year 1 and 0.25–0.4% a year after, reaching 89–92% at year 25. A claim needs the panel’s tested power below that schedule.
What is first-year degradation?
A larger drop in the first year as the cells stabilize. Current warranties allow 1–2% for year one (99% or 98% of rated power), and the national laboratory measured 1.3–1.8% in the first year on TOPCon test modules. After that the decline settles to a slower yearly rate.
Do TOPCon and other N-type panels degrade less?
Their warranties say so — typically 30 years at 0.4% a year after a 1% first year — but field data are short. A July 2026 national-laboratory review found a median of 1.1% a year across the TOPCon data it analyzed, similar to bifacial PERC, with high uncertainty and a call for more monitoring. It also found TOPCon running cooler and producing more than PERC side by side.
Is my system degrading too fast?
Compare the same months across several years. A home system typically loses somewhere between 0.5% and 1.3% a year, so an eight-year-old system should be roughly 3–9% below its first year. A bigger drop usually has a fixable cause — dirt, new shade or a failed inverter or optimizer — before it is a panel warranty case.
Related reading
Sources & methodology
Figures on this page come from the primary sources below and, where noted, from Cali Energy calculations using the stated assumptions. Rates, incentives, and program terms change; each was verified September 28, 2026.
- Compendium of Photovoltaic Degradation Rates (Jordan, Kurtz, VanSant, Newmiller)
- Photovoltaic Degradation Rates — An Analytical Review (Jordan & Kurtz), via OSTI
- PV Fleet Performance Data Initiative — Final Technical Report (NREL/TP-5K00-92444, 2025)
- Deceglie et al. — Fleet-Scale Energy-Yield Degradation Analysis of Residential and Nonresidential PV Systems
- NLR — PV Durability at Scale: Assessing Bifacial and TOPCon Field Performance (NLR/PR-5K00-101394, 2026)
- NLR — PV reliability and system performance research
- Maxeon — Limited Warranty for PV Modules (document 545700, Rev G, effective May 1, 2026)
- Silfab Solar — Limited Product and Linear Performance Warranty (SIL-CS-WRTY-010, Rev Q)
- Canadian Solar — TOPHiKu6 datasheet and warranty terms
- REC — Alpha Pure-RX series
- Qcells — Q.TRON BLK M-G2+
Get panels that are still strong in 25 years
Tell us about your roof and we'll recommend panels with warranty terms that hold up on it — or send your monitoring data and we'll tell you whether your system's decline is normal.
Get a free estimatePrepared by Cali Energy, September 28, 2026. This article is for general educational purposes only and is not legal, tax, financial, engineering, or utility advice. Rates, incentives, codes, permit requirements, equipment specifications, prices, and program terms may change; figures and timelines are estimates, not guarantees. Confirm current requirements with the applicable utility, AHJ, program administrator, manufacturer, or a licensed professional. See our Content Disclaimer. Cali Energy · 19201 Parthenia St, Unit E, Northridge, CA 91324 · CSLB #1032379 (B, C-10, C-39)