

How Accurate Is Cali-Graf? Checked Against Real LADWP and SCE Bills
The bill engine in Cali-Graf — the free solar design and proposal app built by Cali Energy, a Los Angeles solar and roofing contractor — reproduces real utility bills: recalculated from the kilowatt-hours printed on them, LADWP bills come out within ±3 cents of the amount charged, most SCE bills match to the cent, and the right utility is found for 99% of homes. Credit use and surplus credit on real LADWP solar bills are reproduced within 2 cents, and the SCE and Clean Power Alliance rate tables match the printed tariff sheets. Production is modeled hour by hour for every roof face with the U.S. Department of Energy's public engines, Google's shade data and the exact equipment. That makes the first number in a Cali-Graf proposal — the bill today — one the homeowner can check against their own bills.
How the bill math is checked
| Part | How it's checked | Result |
|---|---|---|
| LADWP bills | Real bills recalculated from their own usage, period by period | Within ±3 cents |
| LADWP solar credit | Credit use and surplus credit on real bills of homes with solar | Within 2 cents |
| SCE bills | Real bills recalculated on the customer's plan | Most to the cent |
| Which utility serves the home | Homes with a known utility | 99% right |
| Rate tables | SCE and Clean Power Alliance rates against the printed tariff sheets | Match |
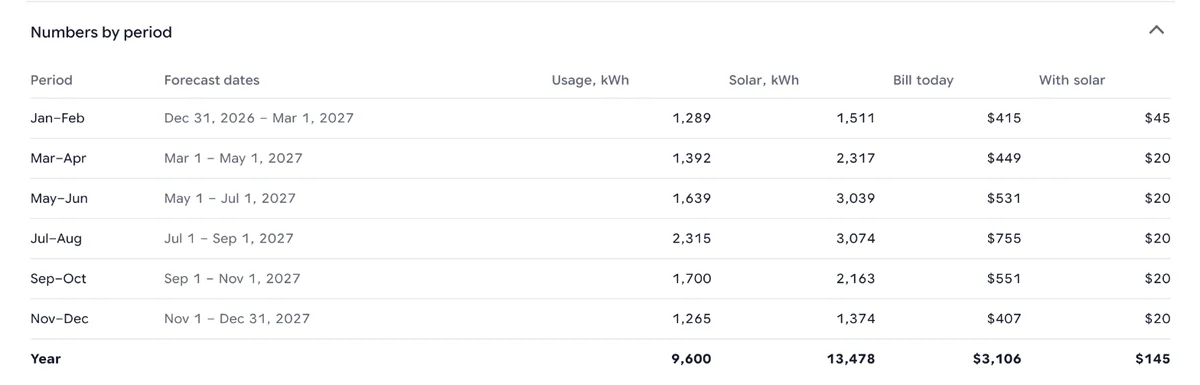
"Recalculated from their usage" means the engine took the kilowatt-hours printed on a real bill, applied the utility's rates and rules for that billing period, and compared its total with the amount the utility actually charged.
Why the bill is the first thing to prove
A solar proposal sells a bill: what the homeowner pays today and what they would pay with solar. If the bill today is wrong, every savings figure built on it is wrong too, however good the production model. So Cali-Graf models each utility's own rules — LADWP's two-month periods, tiers and rollover credit; SCE's time-of-use plans and hourly export credits — instead of an average price per kilowatt-hour, and checks the result against real bills. The method is laid out step by step in how Cali-Graf models an LADWP bill after solar and SCE Net Billing, hour by hour.
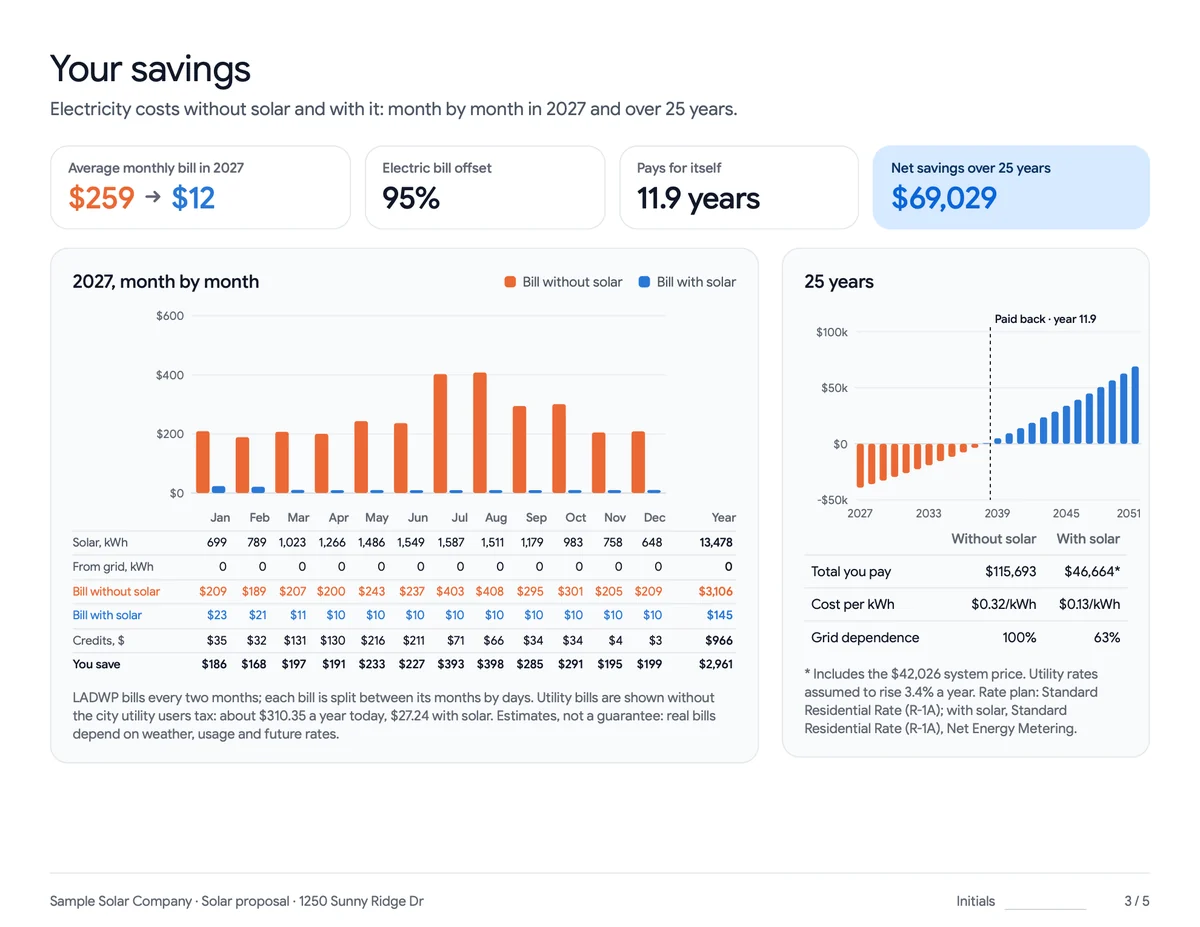
The practical result: a homeowner can check the first number in a Cali-Graf proposal themselves, against the bills on their kitchen table.
The fastest proof is your own: run a home whose bills you know and compare the bill today.
How production is modeled
Production comes from public, widely used engines and data: the National Solar Radiation Database for a typical year of weather and the PVWatts engine in the System Advisor Model for sunlight on each roof face — both from the U.S. Department of Energy's NLR (formerly NREL) — plus Google's height data for the shade at each panel, the exact panel parameters from the California Energy Commission list and the inverter's efficiency curve and power limit. Each roof face is modeled hour by hour; the details are in hour-by-hour production per roof face.
What moves the numbers — and how to tighten them
Every forecast rests on a few inputs about the home and the future. These are the ones that move a Cali-Graf estimate most:
| Input | Why it matters | How to tighten it |
|---|---|---|
| Weather | The calculation uses a typical year; real years are sunnier or cloudier | Present year-one production as typical |
| Hourly habits | On SCE, when the home uses power changes the bill under Net Billing | A Green Button file with the home's own hours, or the time-of-use kWh printed on SCE bills |
| Future rates | The 25-year savings depend on the yearly rate increase assumed | Show the assumption — 3.4% a year by default — and a lower scenario |
| The roof as traced | Pitch, direction, the outline and the image date set production | Check the trace and the image date; confirm the roof on site |
The SCE spread: P20 to P80
For SCE homes, Cali-Graf turns the hourly-habits question into a visible number. It builds the home's hourly usage from 30 similar Los Angeles homes, each fitted to the customer's bills, calculates the bills for all 30, shows the middle result in the summary and, under the bills, the spread of those modeled results — for example "likely $1,180–$1,420 (P20–P80)". It's a range of scenarios that all match the bills, not a promise about where next year's bills will land. A Green Button file replaces the modeled hours with the home's own, which narrows the estimate; weather, future usage and rates still vary. LADWP nets solar one to one over each billing period, so the hour matters little and no range is shown.
Presenting the numbers to a customer
- Lead with what the customer can check. The bill today should match their bills; if it doesn't, fix the usage or the utility line first.
- Call them estimates — the proposal itself says so — and show the rate increase you assumed.
- Explain a wide SCE spread. It reflects how differently households use power at the same monthly totals; the home's Green Button file narrows it — how the customer downloads it.
- Review before sending. Roof design, usage and price, every time — see before you send a solar proposal.
When a customer brings another company's proposal with different numbers, the gap almost always comes from a few assumptions: system losses, shade, rates, credit rules and rate growth — see why two solar proposals disagree. If a customer's bills later run higher than expected, our guide to why a bill can go up after solar covers the usual causes.
Frequently asked
How accurate is Cali-Graf?
How does Cali-Graf calculate solar production?
Why does Cali-Graf show a range for SCE bills?
How can a seller make the estimate tighter?
Why might Cali-Graf's numbers differ from another tool's?
Related reading
Sources & methodology
Product facts on this page come from Cali-Graf's own help center and the pages linked below; figures in examples come from the stated inputs. Features, limits and supported utilities change; each was verified October 16, 2026.
- Cali-Graf Help — How accurate are the numbers
- Cali-Graf Help — How production is calculated
- Cali-Graf Help — Why the first-year forecast is a range
- Cali-Graf Help — Why results differ from other software
- Cali-Graf — Sample proposal (made-up demo home)
- NLR (formerly NREL) — National Solar Radiation Database
- NLR (formerly NREL) — System Advisor Model (SAM)
Check it on a home whose bills you have
Enter a year of a customer's LADWP or SCE bills, compare Cali-Graf's bill today with the bills on the table, then see the bill with solar and the proposal. Free for solar professionals.
Prepared by Cali Energy, October 16, 2026. This article is for general educational purposes only and is not legal, tax, financial, engineering, or utility advice. Rates, incentives, codes, permit requirements, equipment specifications, prices, and program terms may change; figures and timelines are estimates, not guarantees. Confirm current requirements with the applicable utility, AHJ, program administrator, manufacturer, or a licensed professional. See our Content Disclaimer. Cali Energy · 19201 Parthenia St, Unit E, Northridge, CA 91324 · CSLB #1032379 (B, C-10, C-39)