

California rate filings: what SCE, PG&E and SDG&E project for 2027
On their own Q3 2026 filings to the CPUC, SCE’s residential average rate falls about 5% by the end of 2027 while PG&E’s rises 6.7% and SDG&E’s 10.1% — even assuming every pending request is granted. Below: the year-by-year projections to 2029–2030, the bills behind them, what moved since last quarter, and the proceedings driving each utility.
Quick answer
- Last updated October 6, 2026, from the utilities’ Q3 2026 filings to the CPUC — now covering SCE, PG&E and SDG&E. Next update when the Q4 filings publish.
- Will SCE rates go up in 2027? No 2027 change has been announced. On SCE’s own Q3 filing, its bundled residential average rate falls from 32.29¢ at the end of 2026 to 30.65¢ at the end of 2027 — about 5% lower — even with every pending request granted.
- PG&E and SDG&E project increases: PG&E from 34.06¢ to 36.33¢ (+6.7%), SDG&E from 43.52¢ to 47.92¢ (+10.1%), driven by their general rate cases.
- SCE’s latest actual change was small: on October 1, 2026 its average residential rate went from 34.4¢ to 34.5¢, and SCE put a typical 500 kWh bill up 1.5% (SCE rate advisory).
- Everything below is what each utility filed, not what the CPUC approved. Pending requests are frequently reduced.
How to read this tracker
Every California investor-owned utility files a Cost and Rate Tracking Tool with the CPUC each quarter, under Ordering Paragraph 4 of decision D.22-08-023. Those spreadsheets separate authorized revenue from pending requests and show what each would do to rates and to a typical bill. We read the Q3 2026 files directly. Four cautions travel with every number here:
- Filed is not approved. These are the utilities’ own submissions. The CPUC routinely authorizes less than requested.
- Year-end figures assume every pending request is granted in full, which is the most expensive case.
- Two bases for SCE’s rate. The filing spreads the California Climate Credit into the rate: SCE’s June 1, 2026 bundled residential average is 33.16¢ with the credit and 34.42¢ without it — the second is the 34.4¢ SCE quotes on its rate advisories.
- Fewer proceedings are listed than before. Since decision D.25-12-044, affordability metrics are required only for general rate case applications that would raise revenue by more than 1%, so PG&E and SDG&E now list only their big cases.
Source: CPUC — Quarterly Revenue Request Reports, Q2 and Q3 2026 Cost and Rate Tracking Tool files for SCE, PG&E and SDG&E (“Selected Data”, “Summary” and “SAR and RAR” sheets). Verified October 6, 2026.
The three utilities, side by side
| Year | SCE | PG&E | SDG&E |
|---|---|---|---|
| End 2025 | — | 35.04 | — |
| End 2026 | 32.29 | 34.06 | 43.52 |
| End 2027 | 30.65 | 36.33 | 47.92 |
| End 2028 | 30.70 | 34.90 | 48.74 |
| End 2029 | 31.00 | 36.01 | 49.81 |
| End 2030 | 30.92 | — | 49.34 |
| End 2026 → end 2027 | −5.1% | +6.7% | +10.1% |
Each utility’s own Q3 2026 Cost and Rate Tracking Tool, item 4 of “Selected Data”; percentages are Cali Energy arithmetic. Bases differ slightly by utility, so compare directions more than levels.
The direction is the story. SCE trends down through 2027 and then roughly flat; PG&E rises into 2027, dips and rises again; SDG&E climbs every year to 2029. This is a comparison we computed from three filings — none of the utilities presents it — and it shows what is queued in each territory, not what customers will pay.
| Utility | End 2026 | End 2027 | Change |
|---|---|---|---|
| SCE (500 kWh, region 9, Schedule D) | $176.10 | $170.70 | −3.1% |
| PG&E | $200.70 | $209.83 | +4.5% |
| SDG&E (weighted average) | $187.37 | $203.43 | +8.6% |
Item 5 of each utility’s Q3 2026 “Selected Data”. Usage assumptions differ by utility; SCE’s CARE bill goes from $102.80 to $99.27, PG&E’s from $113.37 to $119.03, SDG&E’s from $105.68 to $116.01.
What changed since the Q2 filings
| Utility | Q2 2026 | Q3 2026 | Shift |
|---|---|---|---|
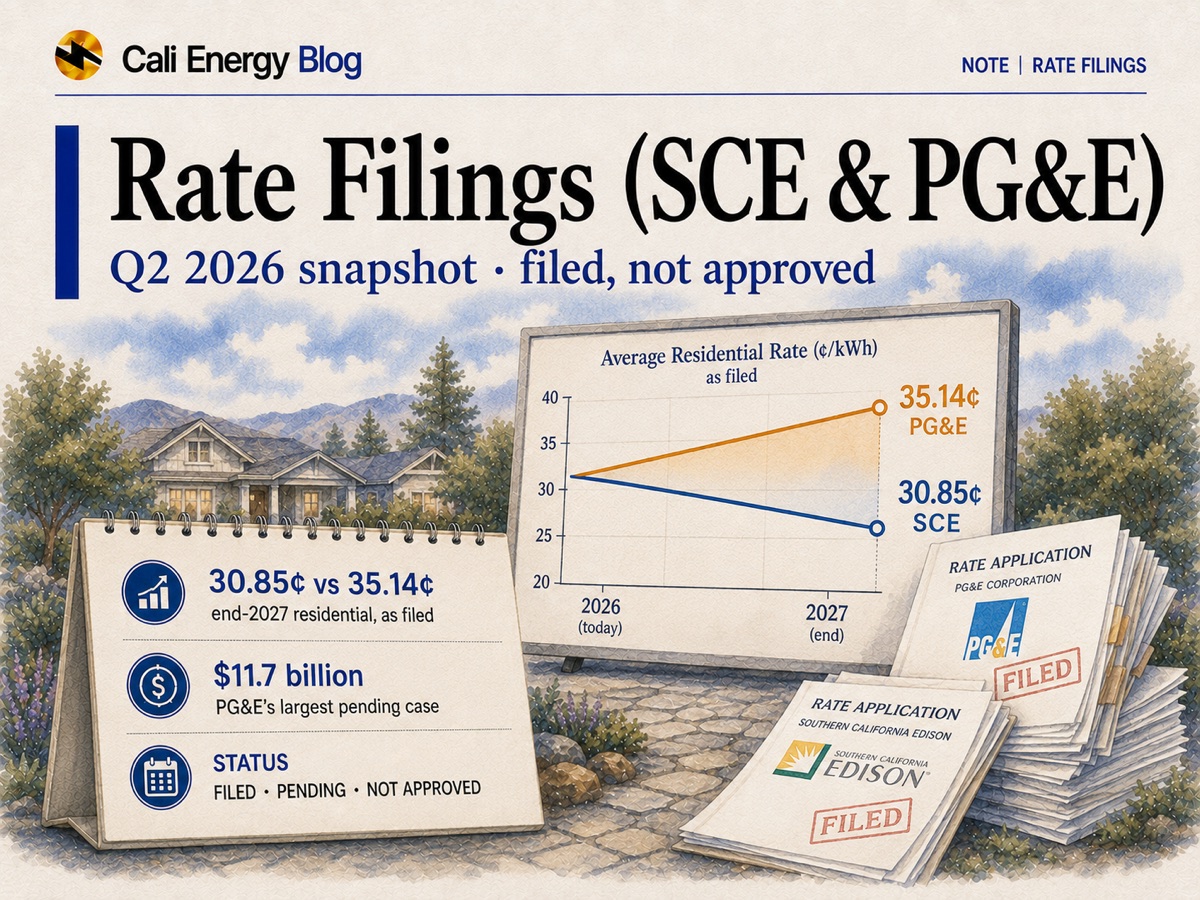
| SCE | 30.85 | 30.65 | −0.20 |
| PG&E | 35.14 | 36.33 | +1.19 |
| SDG&E | 45.56 | 47.92 | +2.36 |
SDG&E’s jump has a clear cause in the filing: its test-year 2028 general rate case (A.26-06-015) entered the pending list, adding about $1.79 billion of incremental revenue over 2027–2030. PG&E’s 2027 rate case is still its largest item, now listed at about $11.38 billion a year (down from $11.72 billion in Q2).
Pending proceedings by utility
| Utility | Proceeding | Revenue requirement ($000) |
|---|---|---|
| PG&E | A.25-05-009 — 2027 GRC Phase 1 | 11,382,534 a year |
| PG&E | A.24-11-009 — 2024 WMCE (wildfire mitigation and catastrophic events) | 201,641 |
| PG&E | A.25-11-001 — Kincade and Dixie wildfire cost recovery | 8,341 |
| SDG&E | A.26-06-015 — test-year 2028 GRC Phase 1 | 1,793,941 (2027–2030) |
| SDG&E | A.22-05-015/016 — GRC Phase 1 Track 3 (WMPMA2) | 667,401 (incremental) |
| SCE | A.25-03-009 — NextGen | 145,266 a year (average, 2025–2032) |
SCE’s rate projection also counts a longer list of smaller pending items: the 2027 ERRA forecast and the 2024 and 2025 ERRA reviews (fuel and purchased power), the 2024 WMCE, Diablo Canyon extended operations charges, a Section 851 sale of North Coast property, the 2028–2033 income-qualified programs and 2028–2035 energy-efficiency applications, AMI 2.0 metering, a Rule 17 application and demand-response bridge funding for 2028–2029. For 2026 itself, SCE’s authorized and “all pending” rates are identical at 32.29¢.
PG&E and SDG&E: item 2 of “Selected Data”. SCE: “Selected Data” and the pending list on its “Summary” sheet. Status: filed / pending, not approved.
The decade behind the current filings
Quarterly filings are a narrow window. For scale, the CPUC’s Public Advocates Office reports that residential average rates rose 101% at SCE, 97% at SDG&E and 69% at PG&E between January 2016 and June 2026. Measured from 2014 the increases are 117% at SDG&E, 97% at SCE and 93% at PG&E, against consumer price inflation of 42%.
The same office names the primary statewide drivers: wildfire mitigation and wildfire liability costs, transmission and distribution investment, and rooftop solar incentives. Wildfire-related revenue requirements alone reached $3.97 billion at PG&E (19% of its total), $2.69 billion at SCE (14%) and $676 million at SDG&E (14%) as of January 2026.
Source: Public Advocates Office at the CPUC — Q2 2026 Electric Rates Report (July 2026), slides 5, 9 and 11.
What this page cannot determine
- What the CPUC will approve. Every pending figure here is a request. Authorized amounts are frequently lower.
- Your rate. These are bundled residential averages on fixed assumptions, not your rate plan, baseline region or usage. CCA customers, such as Clean Power Alliance’s, pay a different generation price.
- Timing within a year. Rate changes take effect on specific dates set by decision; year-end figures hide that.
- Municipal utilities. LADWP, SMUD and other municipals do not file with the CPUC and are not in this tracker — see LADWP rates explained.
Frequently asked
Will SCE rates go up in 2027?
No 2027 change has been announced. On SCE’s Q3 2026 filing to the CPUC, its bundled residential average rate goes from 32.29¢ at the end of 2026 to 30.65¢ at the end of 2027 — about 5% lower — even with all pending requests granted. Its most recent actual change, on October 1, 2026, raised a typical 500 kWh bill 1.5%.
Are PG&E and SDG&E rates going up in 2027?
On their own Q3 2026 filings, yes: PG&E projects 34.06¢ to 36.33¢ (+6.7%) and SDG&E 43.52¢ to 47.92¢ (+10.1%) from end-2026 to end-2027, if every pending request is granted. These are utility submissions, not CPUC decisions.
What is the biggest pending rate case in California?
By revenue requirement, PG&E’s 2027 General Rate Case Phase 1 (A.25-05-009), listed at about $11.38 billion a year in its Q3 2026 filing. SDG&E’s test-year 2028 rate case (A.26-06-015), filed in June 2026, adds about $1.79 billion over 2027–2030.
Why does SCE’s filing show 33¢ when its advisory says 34.4¢?
Different bases. The CPUC filing spreads the California Climate Credit into the average rate: SCE’s June 1, 2026 bundled residential average is 33.16¢ with the credit and 34.42¢ without it. SCE’s rate advisories quote the figure without the credit.
Where does this tracker get its data?
From the Cost and Rate Tracking Tool spreadsheets each investor-owned utility files with the CPUC every quarter under Ordering Paragraph 4 of D.22-08-023, supplemented by the Public Advocates Office quarterly rate report and SCE’s rate advisories. We read the Q3 2026 spreadsheets directly.
Does “pending” mean the increase will happen?
No. Pending means the utility has requested it. The CPUC frequently authorizes less than requested, and timing can shift. That is why this page separates authorized from pending rather than presenting one number.
Is LADWP included?
No. LADWP is a municipal utility and does not file with the CPUC, so it appears in no part of this tracker. The same applies to SMUD and other municipals.
How often is this page updated?
It follows the CPUC quarterly filing cycle. This edition is a snapshot of the Q3 2026 filings, verified October 6, 2026, and covers SCE, PG&E and SDG&E.
Related reading
Sources & methodology
Figures on this page come from the primary sources below and, where noted, from Cali Energy calculations using the stated assumptions. Rates, incentives, and program terms change; each was verified October 6, 2026.
About this reference
Cali Energy is a licensed California contractor (CSLB #1032379) in Northridge. We publish this page as a reference and date it to the day each figure was checked against its source.
Prepared by Cali Energy, October 6, 2026. This article is for general educational purposes only and is not legal, tax, financial, engineering, or utility advice. Rates, incentives, codes, permit requirements, equipment specifications, prices, and program terms may change; figures and timelines are estimates, not guarantees. Confirm current requirements with the applicable utility, AHJ, program administrator, manufacturer, or a licensed professional. See our Content Disclaimer. Cali Energy · 19201 Parthenia St, Unit E, Northridge, CA 91324 · CSLB #1032379 (B, C-10, C-39)