

How Cali-Graf Models an LADWP Bill After Solar
Cali-Graf, the free solar design and proposal app built by Cali Energy, a Los Angeles solar and roofing contractor, calculates an LADWP bill with solar the way LADWP's bills show it, not from an average price per kWh. In each two-month billing period, solar sent to the grid is netted 1:1 against the power taken from it; what's left is billed tier by tier on LADWP's standard residential rate, with the tiers set by the home's Zone 1 or Zone 2. A period with more solar than usage turns the surplus into a dollar credit that rolls forward with no end date but is never paid out — and it pays only the base energy rates and the access charge, not the adjustment factors, taxes or the minimum charge. The engine was worked out from real LADWP bills, and it recalculates them within 3 cents.
Why an average price per kWh gets LADWP wrong
Three things decide an LADWP solar bill, and an average $/kWh misses all of them:
- Two-month periods. Solar nets against usage inside each period, so the same yearly production gives a different bill depending on how it falls across the six periods of the year.
- Tiers by zone. Zone 1 and Zone 2 give each home a different allowance of cheaper kWh per period; the zone comes from LADWP's list of ZIP codes and shows under the address — for example LADWP · Zone 1 — to check against the customer's bill.
- A credit that rolls but never pays out. Surplus solar is worth something only as long as later bills can use it.
The tier sizes, prices and LADWP's own rules are explained in LADWP net metering in 2026 and LADWP electric rates explained; this page is about how Cali-Graf applies them.
Each billing period
Cali-Graf first models production hour by hour for every roof face, then adds it up by the customer's own billing periods. In each period:
- Netting 1:1. The kWh sent to the grid are subtracted from the kWh taken from it.
- Still a net usage? It's billed like a normal bill on the standard residential rate, tier by tier, with the published adjustment factors and the days of the period.
- More sent than taken? There's no energy to pay for; the access charge, taxes and the minimum charge remain. The surplus is valued at the full tier prices, as if it were usage, and becomes a dollar credit.
What the credit pays — and what it doesn't
The credit rolls forward to later bills with no end date, but LADWP never pays it out in cash. When it is applied, it covers only part of a bill:
| Part of the bill | Can the solar credit pay it? |
|---|---|
| Base energy rates, tier by tier | Yes |
| Access charge | Yes |
| Adjustment factors (ECA and others) | No |
| City utility users tax | No |
| The minimum charge | No — the bill doesn't go below it |
So a system that makes 100% of a home's yearly usage still leaves an LADWP bill. Cali-Graf shows that remaining bill rather than a zero.
The access charge, year one and year two
LADWP sets the access charge once a year from the past 12 months. In the first year with solar it stays at the level from before solar; from the second year it follows the home's highest month of grid power with solar. Together with the credit carried over from year one, this is why the second year's bill can differ from the first — and Cali-Graf shows both.
Where it shows in the result
| Where | What it shows |
|---|---|
| The top of the result | Estimated savings, the Electric bill per year today and with solar, and how much of the usage Solar covers |
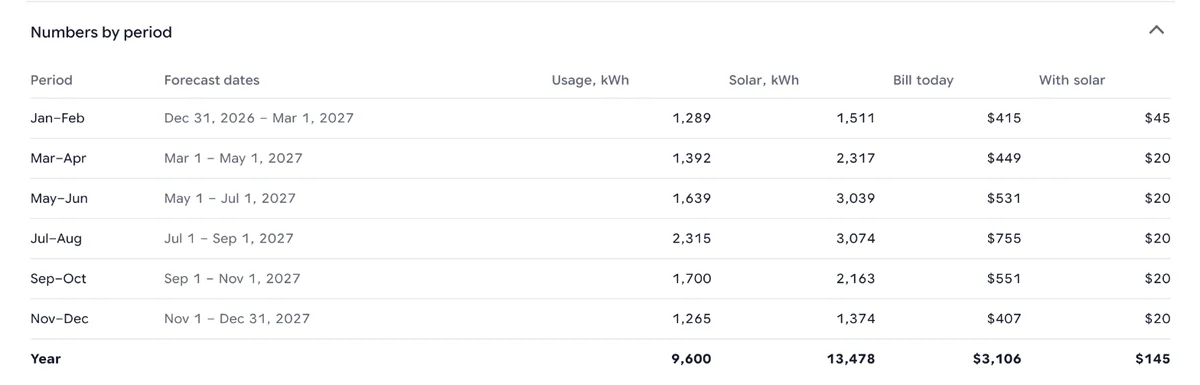
| Numbers by period | Six rows, one per two-month period: the forecast dates a year later, usage, solar, the bill today and the bill with solar |
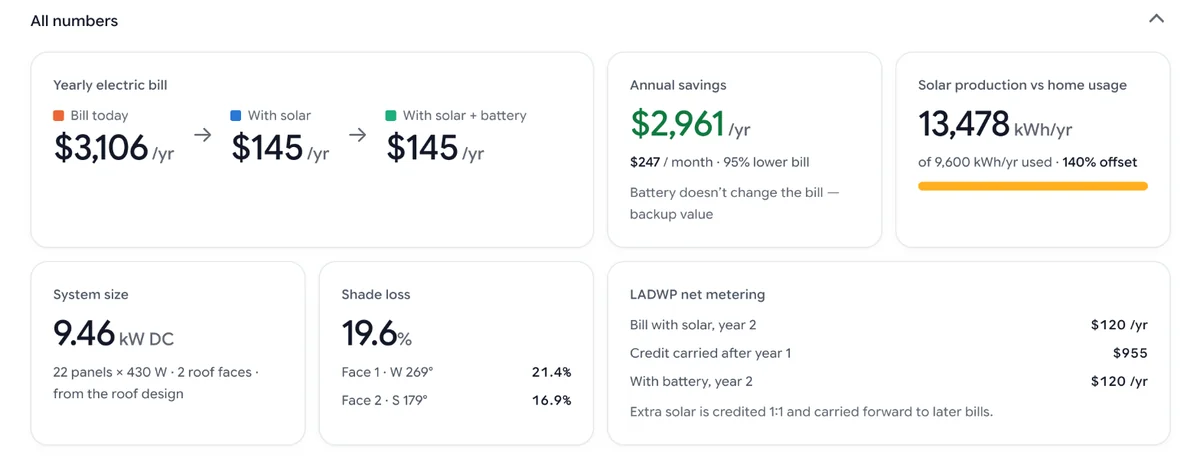
| All numbers → LADWP net metering | Credit carried after year 1 and Bill with solar, year 2, when the first year's credit starts paying |
| Details | The city utility users tax per year, today and with solar — the bills above are shown without it — and the engine notes: the rate plan, the city tax rate, the weather and equipment models |
The result is the first year with solar: the customer's bills rolled forward one year, at today's LADWP rates. The bill "today" is therefore the customer's usage on current rates, and it can differ from an old bill the customer remembers — utilities change their prices several times a year.
When the customer says "that's not my bill"
A homeowner comparing the proposal with a bill on the fridge usually spots a difference. Three reasons cover most of them, in this order:
- The city tax. The bills in the result are shown without the city utility users tax, which is listed separately under Details, today and with solar. The customer's printed bill includes it.
- Today's rates. The result rolls the customer's bills one year forward at current LADWP rates, and LADWP's adjustment factors change every quarter — an old bill was priced on old factors.
- The zone. The line under the address shows the zone Cali-Graf found from the ZIP code; the customer's bill shows LADWP's. If they differ, check that the home was placed on the right roof.
Walking the customer through these turns a doubt into a point of trust: the proposal hides nothing inside the bill.
Oversized systems: credit that's never used
Credit that is never used is lost value: extra panels add cost but almost no savings. When solar makes more than the home uses in a year, the result says so and suggests about how many panels could come off with little loss — to be removed in the roof editor.
Cali-Graf's public LADWP page works this through on the fictional demo home from the in-app tutorial: an LADWP Zone 2 home using 9,600 kWh a year, with 22 panels (9.46 kW). Solar covers 140% of usage; the yearly bill goes from $3,106 today to $145 in year one, and the calculator warns that about $966 of credit is left over after the first year and that roughly six panels could come off with little loss in savings. If the customer expects to use more soon — an electric car, a heat pump — add that usage before calculating rather than keep the extra panels.
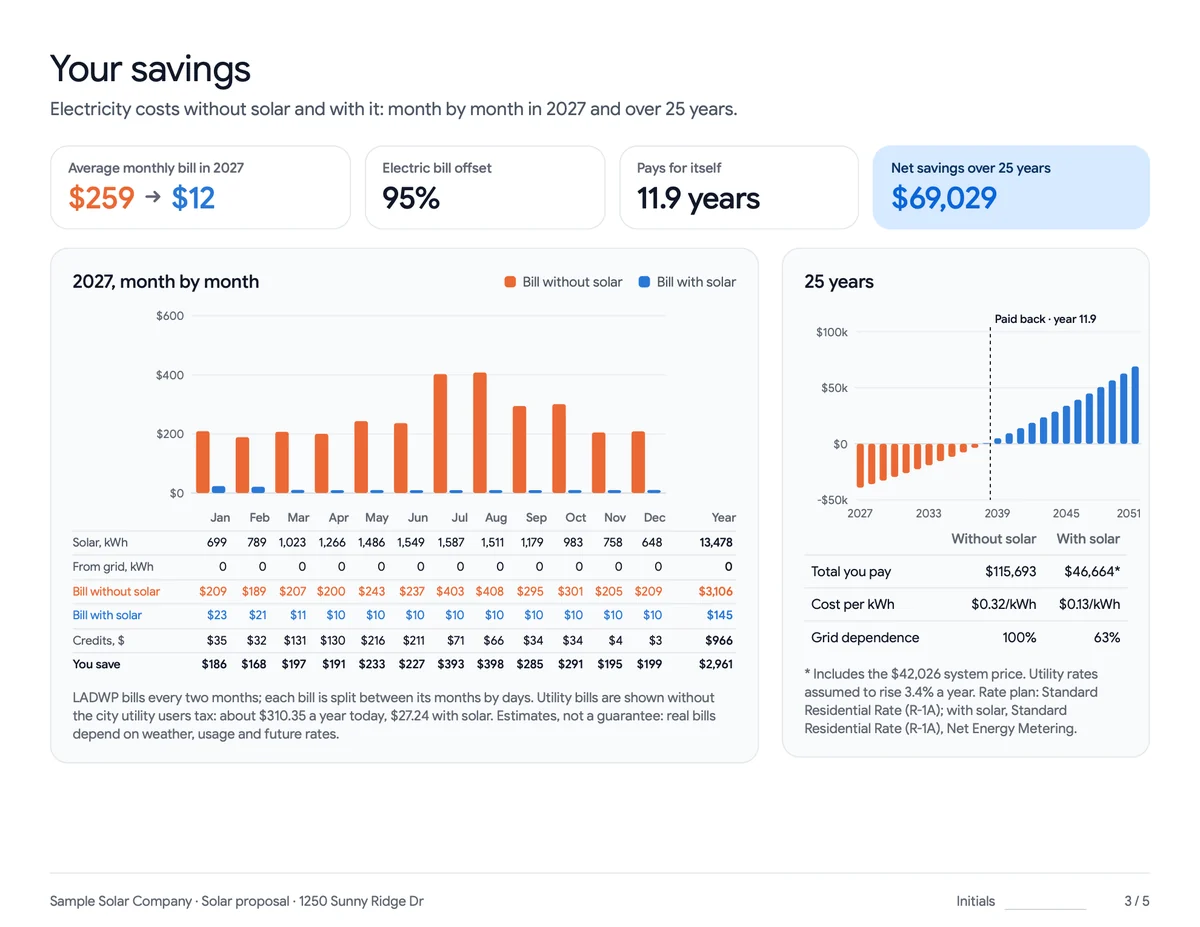
Run an LADWP home whose bills you have and compare the bill without solar with the printed one.
Batteries on LADWP
Under 1:1 netting, every kWh sent to the grid already counts against usage, so storing it rarely saves anything — and a battery loses a little energy on each cycle, which the result can even show as a small cost. Cali-Graf simulates the battery hour by hour and gives its effect on an LADWP bill for the year; its real value for an LADWP home is backup power during outages, and the proposal says so.
Why other estimates often show a lower bill
When a solar estimate for an LADWP home shows a lower bill than Cali-Graf, the credit rules are the usual reason. A tool that nets every kWh fully — letting the credit pay the adjustment factors and taxes too — or that applies an average price per kWh to the year will show a smaller bill with solar than LADWP will send. More on why two proposals for the same home differ in why solar proposals differ.
Checked against real LADWP bills
Cali-Graf's LADWP engine was built against real LADWP bills from 2023–2026. Recalculated from their own usage, they come out within ±3 cents of the printed bill, and the credit used and the credit left over on real bills of homes with solar match within 2 cents. How production is modeled and which inputs move an estimate most: how accurate Cali-Graf is.
Which LADWP rates are covered
Cali-Graf uses LADWP's standard residential rate, R-1 Rate A, with Zone 1 and Zone 2 tiers and the published adjustment factors. Not covered yet:
- the time-of-use rate R-1B, where LADWP credits exports by time block and the credit works differently;
- the EZ-SAVE and Lifeline discounts.
The utility, zone and rate come from the address and can't be changed by hand yet. A customer on R-1B or a discount gets a different bill than Cali-Graf shows; the full list of limits is in What Cali-Graf doesn't do yet.
Frequently asked
How does Cali-Graf calculate LADWP net metering?
What does the LADWP solar credit pay for?
Does LADWP pay out unused solar credit?
Why can the second year's LADWP bill differ from the first?
Which LADWP rates does Cali-Graf support?
How accurate is Cali-Graf's LADWP bill?
Related reading
Sources & methodology
Product facts on this page come from Cali-Graf's own help center and the pages linked below; figures in examples come from the stated inputs. Features, limits and supported utilities change; each was verified October 16, 2026.
- Cali-Graf Help — How the bill after solar is calculated: LADWP
- Cali-Graf Help — Bills by billing period
- Cali-Graf Help — Result details: roof faces, taxes and engine notes
- Cali-Graf Help — How the utility, rate zone and region are found
- Cali-Graf Help — Warnings on the results
- Cali-Graf Help — Why results differ from other software
- Cali-Graf Help — Battery operating modes
- Cali-Graf Help — How accurate are the numbers
- Cali-Graf — LADWP solar bill calculator for installers
- LADWP — Residential electric rates (tiers, zones, adjustment factors)
- LADWP — Net energy metering rates
Model your next LADWP customer's bill
Enter the customer's six two-month bills, design the roof and see the bill with solar period by period — credit, access charge and year two included — on this quarter's LADWP rates. Free, with daily fair-use limits.
Prepared by Cali Energy, October 16, 2026. This article is for general educational purposes only and is not legal, tax, financial, engineering, or utility advice. Rates, incentives, codes, permit requirements, equipment specifications, prices, and program terms may change; figures and timelines are estimates, not guarantees. Confirm current requirements with the applicable utility, AHJ, program administrator, manufacturer, or a licensed professional. See our Content Disclaimer. Cali Energy · 19201 Parthenia St, Unit E, Northridge, CA 91324 · CSLB #1032379 (B, C-10, C-39)