

Modeling SCE Net Billing (NEM 3.0) Hour by Hour in Cali-Graf
Cali-Graf, the free solar design and proposal app built by Cali Energy, a Los Angeles solar and roofing contractor, calculates an SCE bill with solar under the Net Billing Tariff (NEM 3.0) on TOU-D-PRIME, for every hour of the year. Power taken from the grid is paid at the full PRIME price of its hour; power sent to the grid earns that hour's export price, from the CPUC's avoided-cost tables and locked for nine years from the year the system is turned on. The two are not netted against each other. Each month the export credit pays down the energy part of the bill and rolls forward; once a year a true-up settles the energy, and unused export credit is lost. Because the hour matters, Cali-Graf builds the home's hourly usage from its bills and shows the spread of modeled outcomes next to the middle forecast.
Why the hour decides an SCE solar bill
Under the old net metering, a kWh sent to the grid was worth about as much as one taken from it. Under the Net Billing Tariff, it is worth far less at most hours: export prices are highest on summer evenings and low at midday, when most solar is made. So a yearly kWh total says little about the bill — what matters is how much solar the home uses as it is made, and what it buys back in the 4–9 PM peak. How the tariff works, and what exports are worth by year, is covered in NEM 3.0 explained, NEM 3.0 export credits explained and how SCE solar billing works.
The bill today and the bill with solar
The two bills are calculated on different plans, as SCE bills them:
| Bill today | Bill with solar | |
|---|---|---|
| Rate plan | The plan on the customer's bill: TOU-D-4-9PM, TOU-D-5-8PM, TOU-D-PRIME or Domestic (D), with CARE if the bill has it | TOU-D-PRIME under the Net Billing Tariff |
| How it's priced | The plan's prices on the home's usage | Imports at PRIME prices by hour, exports at SCE's hourly export prices |
| Billing | Monthly, by the customer's billing periods | Monthly, plus a yearly true-up |
The customer's current plan is picked from the bill in Usage; it sets what they pay today and therefore how much solar saves. Every SCE home also gets its baseline region from its city, shown under the address — for example SCE · SCE generation · Baseline region 9.
Getting the customer's plan right
The bill today — and so the savings — depends on the plan printed on the customer's SCE bill, next to the charges; a CARE customer also has a CARE discount line. Entering SCE's default plan instead of reading the bill is the most common way to get the savings wrong.
| Plan on the bill | In short |
|---|---|
| TOU-D-4-9PM | Time-of-use with the most expensive hours from 4 to 9 PM — SCE's default for most homes |
| TOU-D-5-8PM | A shorter, pricier peak from 5 to 8 PM |
| TOU-D-PRIME | For homes with an electric car, a battery or a heat pump: cheap off-peak hours and a daily charge; Cali-Graf assumes the car charges at night |
| D (Domestic) | No time-of-use: the price rises as the home uses more in a month |
FERA, Medical Baseline and the all-electric baseline allowance can't be set yet; for those customers the bill today and the savings come out higher than in reality, which is worth saying out loud. How the plans compare for a given household is in SCE time-of-use plans compared.
Hour by hour
For each of the year's hours, Cali-Graf compares what the panels make with what the home uses:
- Solar used at home — the part of production the home uses as it's made. It never reaches the meter, so that power simply isn't bought.
- Taken from the grid — paid at the full TOU-D-PRIME price of that hour.
- Sent to the grid — earns the export price for that hour, from the CPUC's avoided-cost tables and locked for nine years from the year the system is turned on.
Imports and exports in the same month are priced separately, not subtracted from each other. The production behind it is modeled hour by hour for each roof face, from a typical weather year and the shade at each panel — see hour-by-hour production per roof face.
Try it on an SCE home whose bills you have: compare the bill without solar with the printed one, then add a battery and watch the evening hours change.
Month by month and the true-up
Each month, the export credit pays down the energy part of the bill, and what's left rolls forward to the next month. It doesn't pay SCE's daily Base Services Charge, other fixed charges or taxes, so those remain on every bill.
Once a year, at the true-up, the energy for the year is settled, and unused export credit is lost. The yearly bill in the result includes the true-up; when it comes to a dollar or more, All numbers shows Annual true-up included: … and the note under Numbers by period gives the amount.
Clean Power Alliance homes
In Clean Power Alliance cities, SCE bills the delivery and CPA bills the generation, each with its own export credit, carry-forward and true-up — and the two credits don't pay each other's charges. Cali-Graf calculates both sides and uses the city's default CPA plan.
Where the hourly usage comes from
SCE bills say how much a home used each month, not at which hours — and under Net Billing the hours change the bill. Cali-Graf fills them in three ways, from most to least exact:
| Input | What Cali-Graf does | Result |
|---|---|---|
| A Green Button file | Uses the home's own hourly usage | One result |
| Monthly bills with time-of-use kWh | Also matches the on-peak, mid-peak, off-peak and super off-peak split printed on SCE bills | A narrower spread |
| Monthly bills | Fits 30 similar Los Angeles homes from NLR (formerly NREL) ResStock to the bills | The middle result and a spread |
The tiles show the middle of the 30 results; under the bills, All numbers gives the spread, for example likely $1,180–$1,420 (P20–P80): the middle six of every ten modeled patterns fall inside it. It is a spread of scenarios that all match the bills, not a guaranteed interval. For customers on TOU-D-PRIME, Cali-Graf picks similar homes with an electric car and assumes the car charges at night.
The proposal shows the middle forecast. When the spread is wide, tell the customer so: their real bill depends on when the household actually uses power, and on weather and future rates. A Green Button file or the time-of-use kWh from their bills narrows the usage part of it before they sign; a homeowner's guide to downloading the file is in Green Button data for a solar quote. How the profile is built is in where a Cali-Graf proposal's numbers come from.
What drives the savings
Under Net Billing, savings come from solar the home uses as it's made and from what a battery moves into the 4–9 PM peak, more than from yearly kWh. All numbers → How solar is used shows both sides:
- Solar used by home — the share of production the home uses directly;
- Home powered by solar — the share of the home's usage covered by solar.
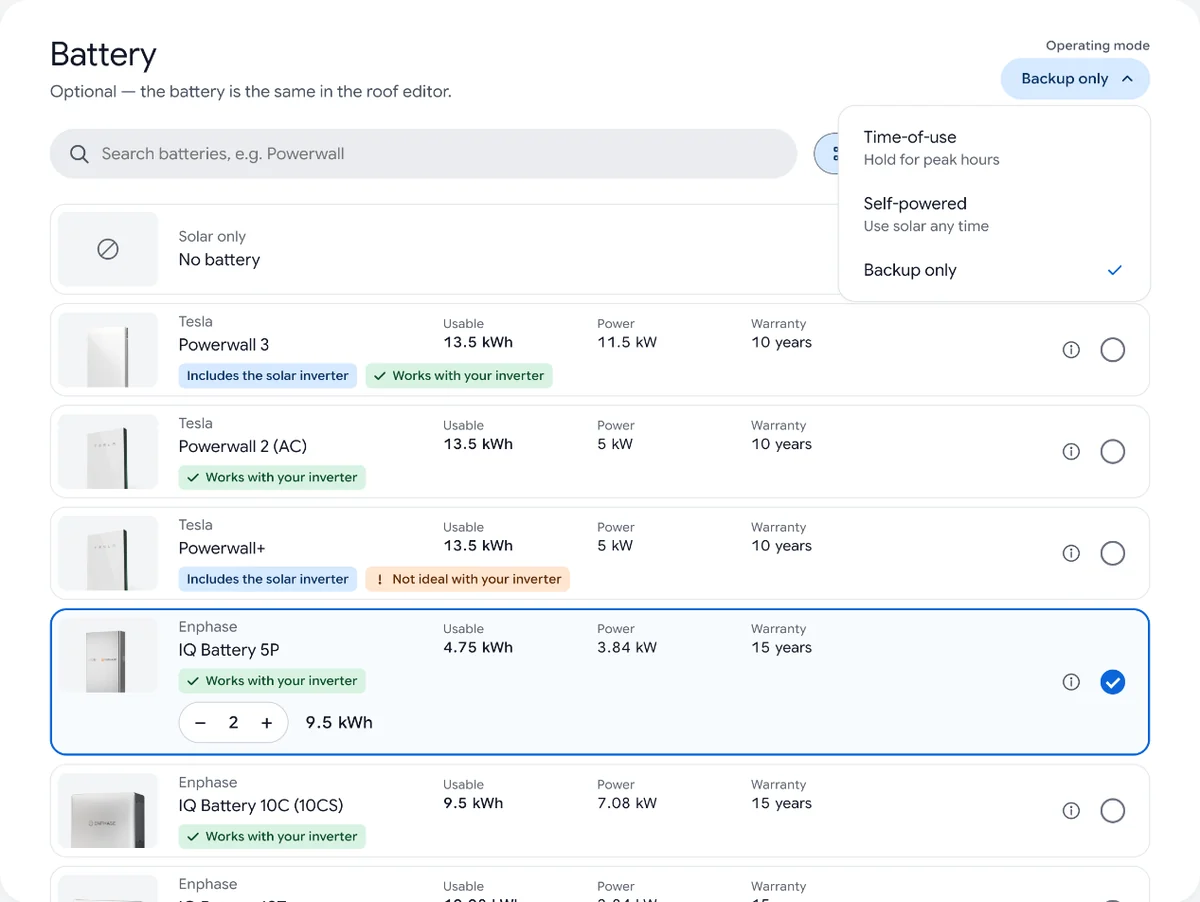
A battery charged from solar and discharged in the evening turns low-value exports into avoided peak purchases, which is why it can change an SCE bill noticeably — unlike an LADWP bill, where 1:1 netting leaves it little to do. The battery's modes are explained in the help center's battery operating modes, and the case for and against one in do I need a battery with NEM 3.0. Oversizing is a weak lever: SCE pays little for surplus power, so the result warns when a system makes more than the home uses.
Checked against SCE bills and tariffs
Real SCE bills recalculated on the customer's own plan match most to the cent, and Cali-Graf's SCE and Clean Power Alliance rate tables match the printed tariff sheets. The proposal presents its numbers as estimates. Details in how accurate Cali-Graf is.
Which plans and discounts are covered
- FERA, Medical Baseline and the all-electric baseline allowance can't be set yet; for those customers the bill today — and the savings — can come out higher than in reality.
- The bill with solar is always on TOU-D-PRIME; other plans with solar aren't modeled.
- For CPA homes, only the city's default CPA plan.
Frequently asked
How does Cali-Graf calculate NEM 3.0 savings for SCE homes?
Which SCE rate plan does Cali-Graf use for the bill with solar?
What can SCE export credits pay for?
Why does Cali-Graf show a range for SCE bills?
Does Cali-Graf model Clean Power Alliance customers?
How accurate is Cali-Graf's SCE bill?
Related reading
Sources & methodology
Product facts on this page come from Cali-Graf's own help center and the pages linked below; figures in examples come from the stated inputs. Features, limits and supported utilities change; each was verified October 16, 2026.
- Cali-Graf Help — How the bill after solar is calculated: SCE NEM 3.0
- Cali-Graf Help — Choose the customer's SCE rate plan and CARE
- Cali-Graf Help — Why the first-year forecast is a range
- Cali-Graf Help — How the hourly usage profile is built
- Cali-Graf Help — Enter time-of-use kWh from SCE bills
- Cali-Graf Help — Bills by billing period
- Cali-Graf Help — Battery operating modes
- Cali-Graf Help — How accurate are the numbers
- SCE — Tariff books
Run your next SCE customer hour by hour
Pick the plan from the customer's bill, add a Green Button file or the time-of-use kWh, design the roof and see the bill with solar under Net Billing, with or without a battery. Free, with daily fair-use limits.
Prepared by Cali Energy, October 16, 2026. This article is for general educational purposes only and is not legal, tax, financial, engineering, or utility advice. Rates, incentives, codes, permit requirements, equipment specifications, prices, and program terms may change; figures and timelines are estimates, not guarantees. Confirm current requirements with the applicable utility, AHJ, program administrator, manufacturer, or a licensed professional. See our Content Disclaimer. Cali Energy · 19201 Parthenia St, Unit E, Northridge, CA 91324 · CSLB #1032379 (B, C-10, C-39)