

Hour-by-Hour Solar Production per Roof Face: Inside the Model
Cali-Graf, the free solar design and proposal app built by Cali Energy, a Los Angeles solar and roofing contractor, calculates solar production for each roof face separately, for every hour of a typical year. It takes the face's pitch and direction from the roof you traced, the weather for the home's ZIP code from the National Solar Radiation Database, the sunlight on that face from the PVWatts engine in the System Advisor Model, the shade of trees, chimneys and neighbors at each panel's exact spot from Google's height data, and the exact panel and inverter models — then takes off 7.77% for real-world losses. The result is the production every bill and saving in the proposal is built on.
From the drawing to the model
The calculator never asks for tilt or azimuth. Each time the roof is saved, the roof editor sends the calculator three things:
- the panel — its power and specifications;
- every face with panels — its pitch and direction, and how many panels sit on it; each face becomes its own array;
- where each panel sits — for the shade at that exact spot.
Faces without panels don't enter the production calculation, though they still shape the fire setbacks. A panel is not counted when it sits off every roof face, on a face without a pitch, or on top of another panel, and the calculator says how many panels aren't counted and why. A panel shown in red — inside a setback or on an obstacle — is still counted, which is why Cali-Graf asks for it to be fixed before the proposal. Details: how the roof gets into the calculation.
The model, step by step
For every roof face with panels, Cali-Graf works through the same chain:
| Step | What is modeled | Source |
|---|---|---|
| Weather | A typical year of hourly sunlight and temperature for the home's ZIP code | National Solar Radiation Database (NSRDB) of NLR, formerly NREL |
| Sun on the panels | The light reaching the face every hour, from its pitch and direction | NLR's PVWatts engine in its System Advisor Model (SAM) |
| Shade | The shade of trees, chimneys and neighbors at every panel's spot, taken out hour by hour | Google's 3D height data (Solar API) |
| Heat and the panel | Hot panels make less; one panel's output is modeled with the exact model's parameters, then multiplied by the panels on the face | California Energy Commission panel list and SAM panel models |
| Inverter | The exact inverter's efficiency curve and power limit; microinverters panel by panel, string and hybrid inverters across the whole array | Sandia inverter model, CEC inverter list |
| Losses | 7.77% for real-world losses on top | Cali-Graf's stated loss assumptions |
Because each face is its own array, an east face and a west face on the same house are modeled with their own sun and shade, and the way a microinverter system differs from a string inverter — a shaded panel holding back the others, or not — is reflected in the result.
Shade, measured rather than assumed
Shade analysis is on by default. For every panel, Cali-Graf works out when through the year trees, chimneys and nearby buildings shade that exact spot, and takes that out of the production hour by hour. If a seller turns it off — only when the shade on the image is gone, such as a tree that has been cut down — a standard 3% is taken for shade instead. Cali-Graf's own warning: on a shaded roof, the standard 3% is far less than the real loss, so production and savings would come out higher than the home will see. Details: turn shade analysis on or off.
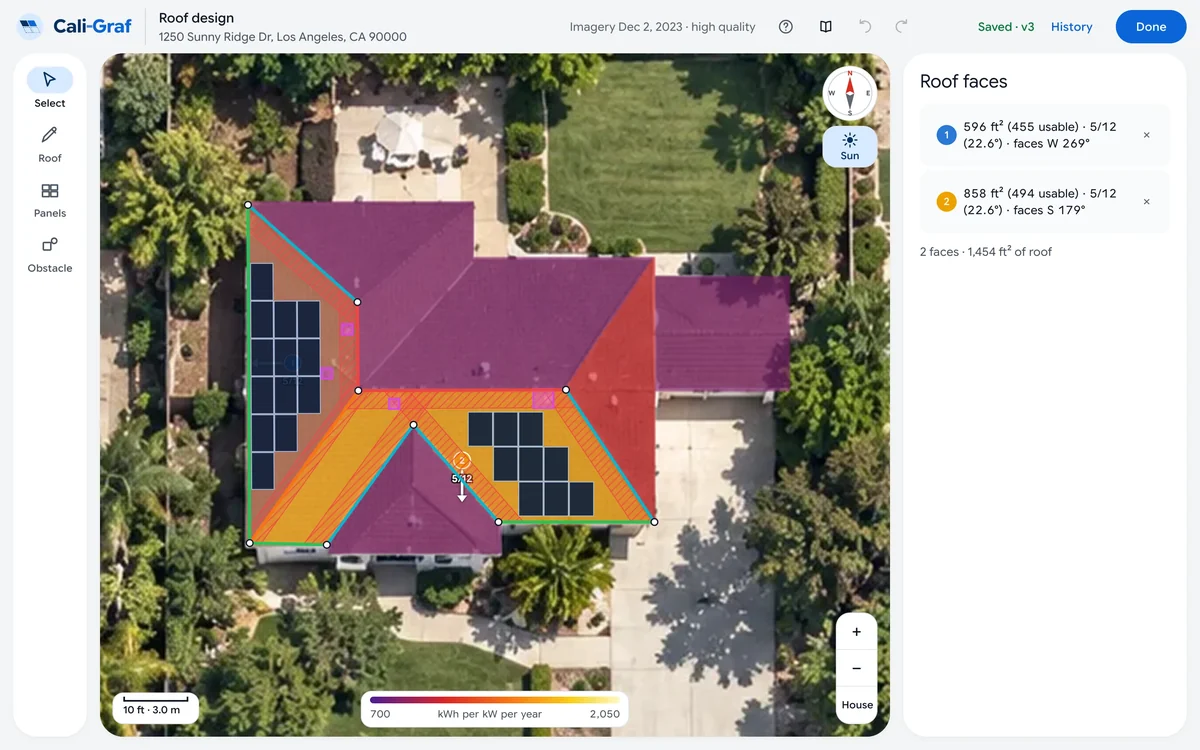
In the roof editor, the sun map shows the same thing at a glance. It colors the roof by how much sun each spot gets in a year, from about 700 to 2,050 kWh per kW of panels — yellow sunniest, purple shaded or facing away — and each face shows its average as Sun on this face. Two faces with the same direction can be worlds apart if a tree shades one of them all afternoon. The sun map comes from Google Solar's yearly calculation for every 10 cm of the roof; Cali-Graf's own production model is separate and hour by hour, but the two agree on which spots are worth panels. Details: sun map.
Open a roof you know in Cali-Graf, turn on the sun map and see which faces are worth panels.
Losses: 7.77%, itemized
On top of shade, Cali-Graf takes off a fixed set of real-world losses:
| Loss | Share |
|---|---|
| Dirt on the panels (soiling) | 2% |
| Nameplate tolerance | 1% |
| Early light-induced degradation | 1.5% |
| Connections | 0.5% |
| System availability | 3% |
| Total | 7.77% |
The total is 7.77% rather than 8% because losses compound rather than add. Many solar tools instead apply a single default figure — the PVWatts calculator's default total system losses are 14% — which includes a fixed allowance for shade rather than a measured one. That difference in method is one reason two proposals for the same roof disagree; see why two solar proposals disagree.
What you see in the result
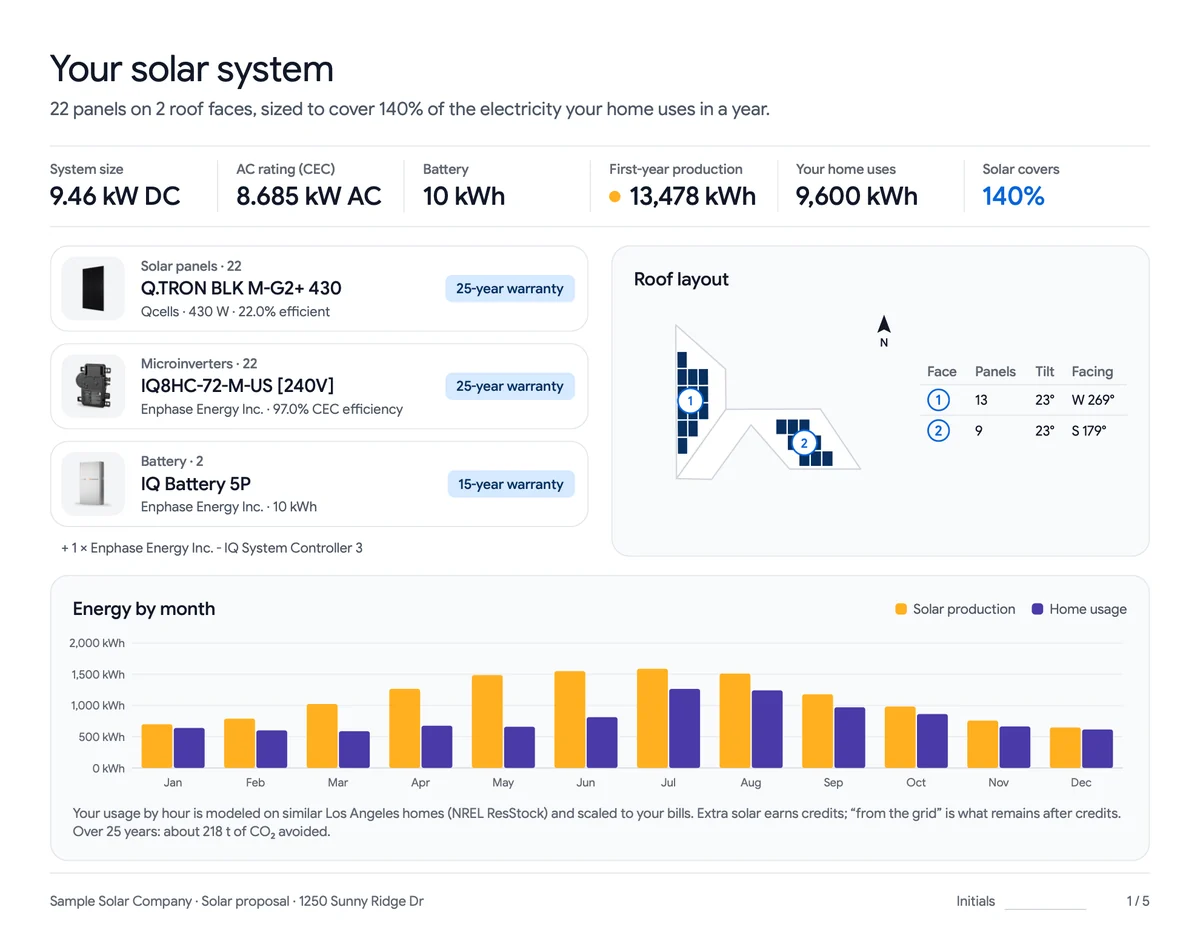
- Yearly production sits next to the home's usage in the result, with production by billing period in Numbers by period.
- Shade loss per face is listed in All numbers, so a seller can see how much each face loses to shade.
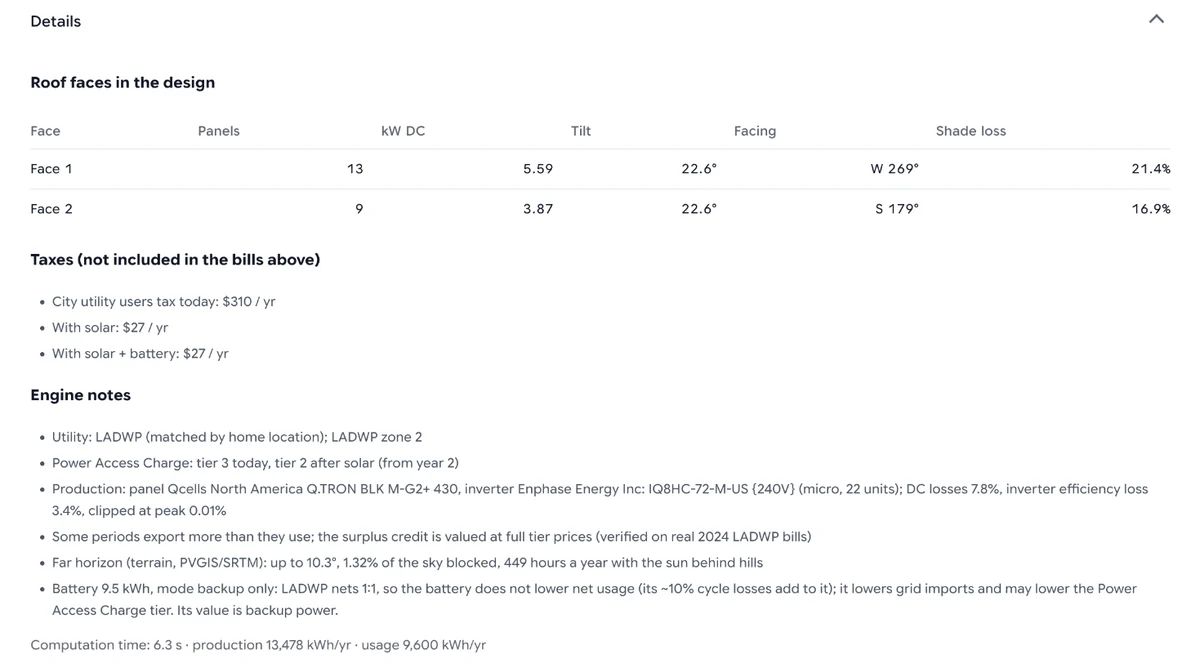
- Details, at the bottom of the result, lists every face with panels — how many, the tilt and which way it faces — and the engine's notes on the weather and equipment models used. If production looks off, checking each face's tilt and direction against the design is the first step.
Panels also lose a little output each year; the 25-year forecast applies the degradation rate from the panel's datasheet, and the line above the 25-year chart names it. For background on panel aging, see solar panel degradation in California.
What any production model depends on
Cali-Graf's production model is built on public, widely used engines and data — NSRDB weather, PVWatts in SAM, CEC equipment parameters — with shade measured at each panel. How the bill side is checked against real bills is in how accurate Cali-Graf is. Three things to keep in mind with any production estimate:
- A typical year is not next year. The weather input is a typical year; real years are sunnier or cloudier.
- The roof as traced. A pitch or direction off by a few degrees, a face traced too big, or an aerial image older than a new tree or addition changes production. The model does not replace a site visit.
- Data availability. Google has no 3D roof data for some homes, mostly new construction and some rural areas, and those can't be designed in Cali-Graf for now.
How a per-face model compares with a city-level calculator on the same home is shown in why an online solar estimate differs from a roof-specific design.
Frequently asked
How does Cali-Graf calculate solar production?
Does Cali-Graf use PVWatts?
How is shade calculated?
Why are Cali-Graf's system losses 7.77% instead of 14%?
What data is the production model built on?
Related reading
Sources & methodology
Product facts on this page come from Cali-Graf's own help center and the pages linked below; figures in examples come from the stated inputs. Features, limits and supported utilities change; each was verified October 16, 2026.
- Cali-Graf Help — How production is calculated
- Cali-Graf Help — How the roof gets into the calculation
- Cali-Graf Help — Turn shade analysis on or off
- Cali-Graf Help — Sun map
- Cali-Graf Help — Data sources
- Cali-Graf Help — How accurate are the numbers
- NLR (formerly NREL) — National Solar Radiation Database
- NLR (formerly NREL) — System Advisor Model (SAM)
- NLR (formerly NREL) — PVWatts Calculator
- California Energy Commission — Solar Equipment Lists
- Google — Solar API overview
Model a roof face by face
Trace the roof, let Fill roof place the panels and see production per face with measured shade, the exact panel and inverter, and itemized losses. Free in Cali-Graf, with daily fair-use limits.
Prepared by Cali Energy, October 16, 2026. This article is for general educational purposes only and is not legal, tax, financial, engineering, or utility advice. Rates, incentives, codes, permit requirements, equipment specifications, prices, and program terms may change; figures and timelines are estimates, not guarantees. Confirm current requirements with the applicable utility, AHJ, program administrator, manufacturer, or a licensed professional. See our Content Disclaimer. Cali Energy · 19201 Parthenia St, Unit E, Northridge, CA 91324 · CSLB #1032379 (B, C-10, C-39)