

Same Roof, Different Numbers: Why Two Solar Proposals Disagree
When a homeowner puts two solar proposals for the same roof side by side, the yearly production, the bill with solar and the 25-year savings rarely match — and the gap can run to thousands of dollars. It almost always comes from a few assumptions: how much production is lost to shade and wiring, which equipment is modeled, which year's rates are used, how the utility's credit rules are applied and how fast rates are assumed to rise. Neither proposal has to be wrong. A seller who knows these assumptions can explain the difference — and compare the two on the same footing. The examples here come from Cali-Graf, the free solar design and proposal app built by Cali Energy, a Los Angeles solar and roofing contractor, which prints each of these assumptions with the result.
Where production numbers part ways
Production is the first number every bill and saving is built on, so small differences here carry through everything else.
| Assumption | How Cali-Graf models it | Common alternative |
|---|---|---|
| System losses | 7.77% for real-world losses — soiling 2%, nameplate tolerance 1%, early light-induced degradation 1.5%, connections 0.5%, system availability 3% — with shade measured separately | A single default figure, such as the 14% default total losses of the PVWatts model, which bundles a fixed allowance for shade |
| Shade | Measured at every panel, hour by hour, from Google's height data for trees, chimneys and neighbors | A flat percentage, which can be higher or lower than the real shade |
| Equipment | The exact panel's parameters from the California Energy Commission list and the exact inverter's efficiency curve and power limit; microinverters modeled panel by panel | A generic panel and inverter that treat every system the same |
| Roof geometry | Each face's pitch and direction measured from Google's 3D height data | A typical tilt and direction, or a face traced by eye |
On a roof with little shade, a 14% blanket loss against 7.77% plus measured shade is a difference of several percent of yearly production before anything else is considered. On a heavily shaded roof the difference can run the other way. Neither figure is a trick; they are different methods, and Cali-Graf lists its own in how production is calculated.
The roof itself is the other big lever: a pitch or direction off by a few degrees, or a face traced larger than it is, changes the result in any tool.
Where bill numbers part ways
Two proposals can agree on production and still disagree on the bill:
- Which rates. Cali-Graf uses the utility's current rates. A proposal made last year used last year's; for how often California rates move, see our California rate changes tracker.
- The utility's credit rules. Under LADWP net metering, solar credit pays only the base energy rates and the access charge — not the adjustment factors or taxes — and it rolls forward without ever being paid out. A tool that nets every kilowatt-hour fully will show a lower bill with solar than the customer will actually see. This is also why a system that makes 100% of a home's usage still leaves an LADWP bill.
- Real billing periods. Cali-Graf follows the customer's own billing periods and seasons — six two-month LADWP periods or twelve SCE months — rather than a yearly average.
- The federal tax credit. Older proposals subtract the 30% federal Residential Clean Energy Credit, which is not available for systems placed in service after December 31, 2025. Cali-Graf subtracts none. Background: the 30% solar tax credit ended.
- Rate growth. The 25-year savings depend heavily on the yearly rate increase each tool assumes. Cali-Graf uses 3.4% a year unless the seller sets another value, and shows the assumption on the 25-year tab.
Two different "25-year savings"
Even the same phrase can mean two things. In Cali-Graf, bill savings over 25 years counts only bills without solar minus bills with solar, while 25-year savings on the price tile and the proposal cover also subtracts what the customer pays for the system. If one proposal shows gross bill savings and another shows net savings, the gap between them is roughly the price of the system.
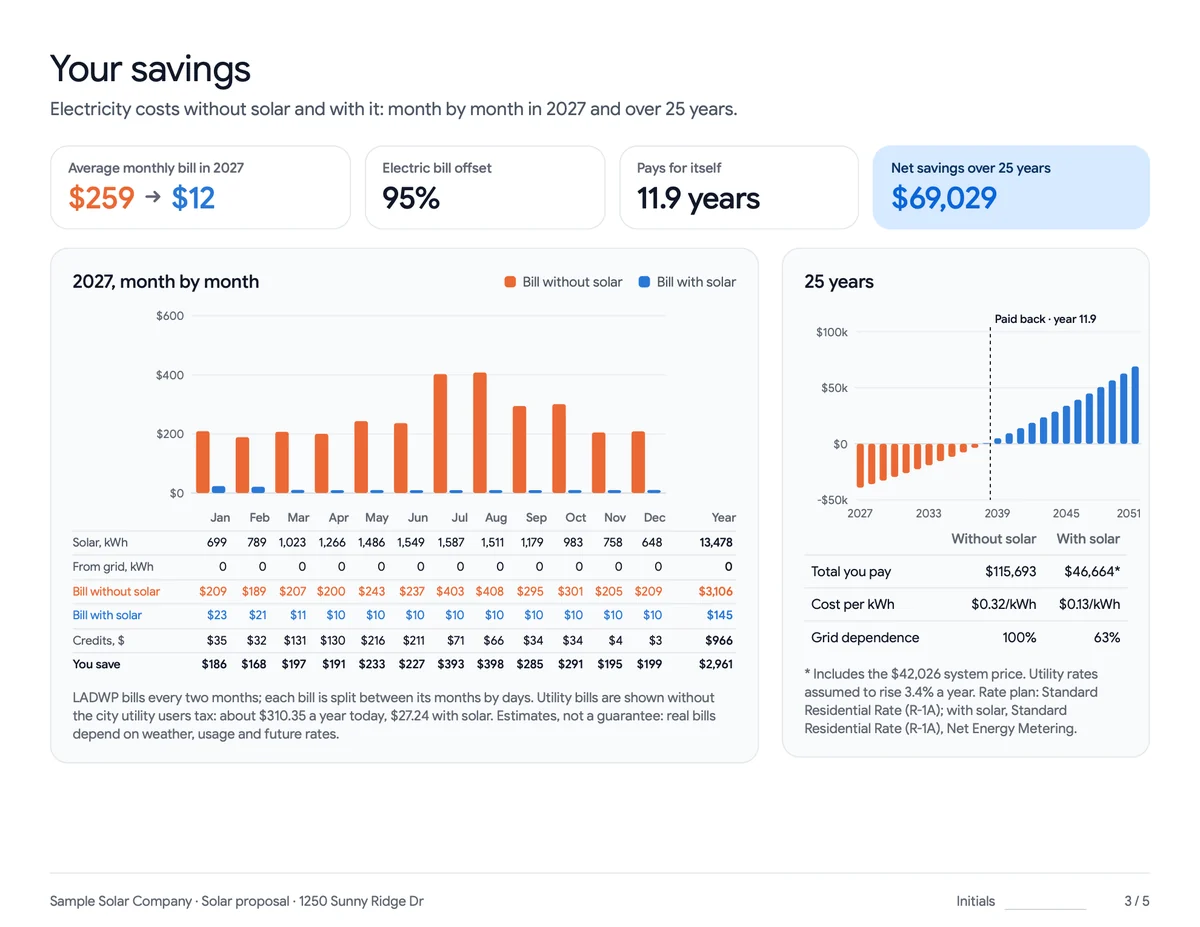
How to compare fairly
Cali-Graf's help center gives a simple rule: put both on the same footing, then compare the numbers where real differences show.
| Make these the same | Then compare |
|---|---|
| System size (kW DC) | First-year production (kWh) |
| The customer's usage (same bills or yearly total) | First-year bill with solar |
| The rate increase assumed for future years | — |
| Whether the price is gross or net of any credit | — |
In Cali-Graf, the easiest way to do this is Make a copy of the calculation and change only what differs — for example, set the rate increase on the 25 years tab to the other proposal's value — so the original stays untouched. When a number needs explaining, Details at the bottom of the result lists the roof faces in the design with their tilt and direction, the city utility tax that is shown separately from the bills, and the engine's notes on which rate plans, weather and equipment models were used. Shade loss per face is in All numbers.
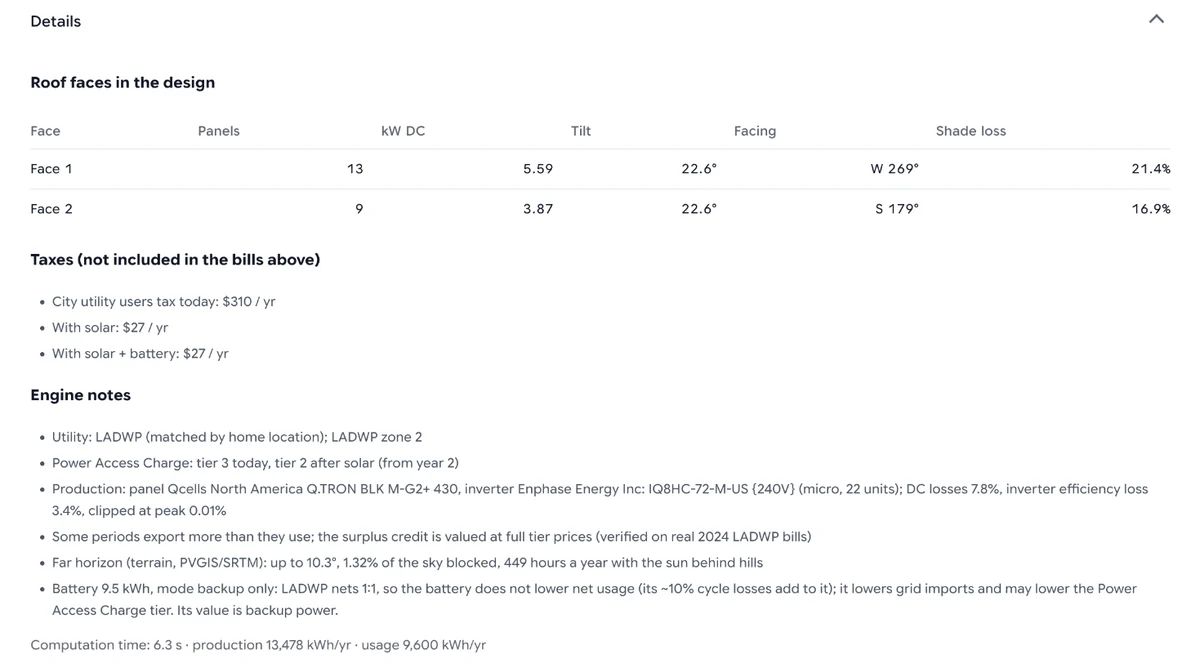
Customer holding another quote? Run their home in Cali-Graf, make a copy with the other proposal's assumptions and show both.
Explaining it to the homeowner
The conversation goes better when it is about assumptions rather than about who is right:
- Start with the bill they already pay. Both proposals should show a today-bill that matches the customer's own bills; if one doesn't, that is the first difference to resolve.
- Name the assumptions. Losses, shade, rates and rate growth — say which each proposal used, without calling either one wrong.
- Compare first-year numbers. First-year production and the first-year bill with solar are where real differences show; 25-year totals mostly amplify the rate-growth assumption.
- Say what can move. Weather, how the household uses power and future rates will move real results either way, in any tool. How Cali-Graf checks its own numbers against real bills is in how accurate Cali-Graf is.
For homeowners comparing quotes on their own, our compare solar quotes checklist and solar quote red flags cover the non-technical side — license, warranties, payment terms and pressure tactics. When the other number comes from an online calculator rather than a proposal, why an online solar estimate differs from a roof-specific design walks through the gap with a worked example.
Frequently asked
Why do two solar quotes show different savings for the same house?
Is a proposal with higher savings wrong?
Why does Cali-Graf show a higher LADWP bill with solar than some tools?
What rate increase does Cali-Graf assume?
Does Cali-Graf subtract the 30% federal tax credit?
Related reading
Sources & methodology
Product facts on this page come from Cali-Graf's own help center and the pages linked below; figures in examples come from the stated inputs. Features, limits and supported utilities change; each was verified October 16, 2026.
- Cali-Graf Help — Why results differ from other software
- Cali-Graf Help — How production is calculated
- Cali-Graf Help — How the bill after solar is calculated: LADWP
- Cali-Graf Help — Savings over 25 years
- Cali-Graf Help — Result details: roof faces, taxes and engine notes
- Cali-Graf Help — Compare options for one customer
- Cali-Graf Help — Federal tax credit
- NLR (formerly NREL) — PVWatts Calculator (system losses defaults)
- IRS — Residential Clean Energy Credit
Put the other proposal on the same footing
Copy your calculation, match the other proposal's system size, usage and rate increase, and compare first-year production and bills side by side — with every assumption printed. Free in Cali-Graf, with daily fair-use limits.
Prepared by Cali Energy, October 16, 2026. This article is for general educational purposes only and is not legal, tax, financial, engineering, or utility advice. Rates, incentives, codes, permit requirements, equipment specifications, prices, and program terms may change; figures and timelines are estimates, not guarantees. Confirm current requirements with the applicable utility, AHJ, program administrator, manufacturer, or a licensed professional. See our Content Disclaimer. Cali Energy · 19201 Parthenia St, Unit E, Northridge, CA 91324 · CSLB #1032379 (B, C-10, C-39)