

Where a Cali-Graf Proposal's Numbers Come From: The Public Data Chain
Every number in a proposal from Cali-Graf — the free solar design and proposal app built by Cali Energy, a Los Angeles solar and roofing contractor — goes back to a public source. The address is placed with Los Angeles County address points or Google geocoding; the roof, its 3D heights and the shade come from Google's Solar API; the weather from the National Solar Radiation Database; production from the PVWatts engine in the System Advisor Model; the home's hourly usage from a Green Button file or from ResStock homes in Los Angeles; equipment from the California Energy Commission lists; and the bill from the utilities' own published rates. This page follows that chain step by step and explains what each source changes in the final numbers. The plain list of sources, with links, is on Cali-Graf's data sources page.
Step 1 — The address
Source: in Los Angeles County, the county's Address Points; elsewhere, Google's Geocoding API.
What it changes: where the home is — and from that, almost everything else: the utility and its rate zone or region, the city's utility users tax, the weather location and which aerial image and height data are loaded. An address-point suggestion comes with its exact point; an address found through Google is placed by Google, which is why Cali-Graf asks the seller to check that the pin sits on the right roof.
Step 2 — The utility, zone and region
Source: the California Energy Commission's map of electric load-serving entities, LADWP's table of residential zones by ZIP code, and city-level data for SCE baseline regions and Clean Power Alliance.
What it changes: which rate book applies and which tier or baseline allowance the home gets. The same usage produces a different bill in LADWP Zone 1 or Zone 2, in a different SCE baseline region or in a Clean Power Alliance city. Cali-Graf shows the result under the address — for example LADWP · Zone 1 or SCE · SCE generation · Baseline region 9 — and gets the utility right for 99% of homes; the rare miss sits on a utility border.
Where it can go wrong: near borders. Where a ZIP code is split between LADWP and SCE, the city decides — a Los Angeles neighborhood is LADWP, Santa Monica or Culver City is SCE — and Cali-Graf goes by the city a home legally belongs to rather than its mailing name, so a Van Nuys address counts as Los Angeles. City-owned utilities such as Glendale, Burbank and Pasadena are recognized, but their bills can't be calculated yet: the line under the address turns red, and the roof can still be designed. The utility can't be changed by hand yet; when the line differs from the customer's bill, check first that the pin sits on the right roof.
Step 3 — The roof, heights and shade
Source: Google's Solar API — the aerial photo, the 3D height map of roofs and trees, and the shade around the home.
What it changes: the geometry and the shade. Each roof face's pitch and direction are measured from the height data, and shade from trees, chimneys and neighbors is worked out for every panel's spot. A newer tree or a demolished building that the image doesn't show will skew both, which is why the image date is shown and the trace should be checked against the real roof.
Step 4 — Fire setbacks
Source: California Residential Code R329.6 and the Los Angeles Fire Department's rules for homes.
What it changes: where panels can go — and so how many fit. Under the California code, the ridge setback grows from 18 to 36 inches when solar covers more than a third of the roof, and Cali-Graf lays the panels out again when that happens. The plan reviewer and the local fire department have the final say on each job.
Step 5 — The weather
Source: a typical year of hourly sun and temperature from the National Solar Radiation Database (NSRDB) of NLR — the U.S. Department of Energy's national laboratory, formerly NREL.
What it changes: how much sunlight reaches the roof each hour, and how hot the panels run. It is a typical year, not a forecast: real years are sunnier or cloudier.
Privacy note: the weather service receives only the approximate center of the home's ZIP code. A separate terrain service, the European Commission's PVGIS, receives the location rounded to about 100 meters to measure hills on the horizon. Neither receives an address or a name.
Step 6 — Production
Source: NLR's PVWatts engine in its System Advisor Model (SAM), with the California Energy Commission's panel and inverter models.
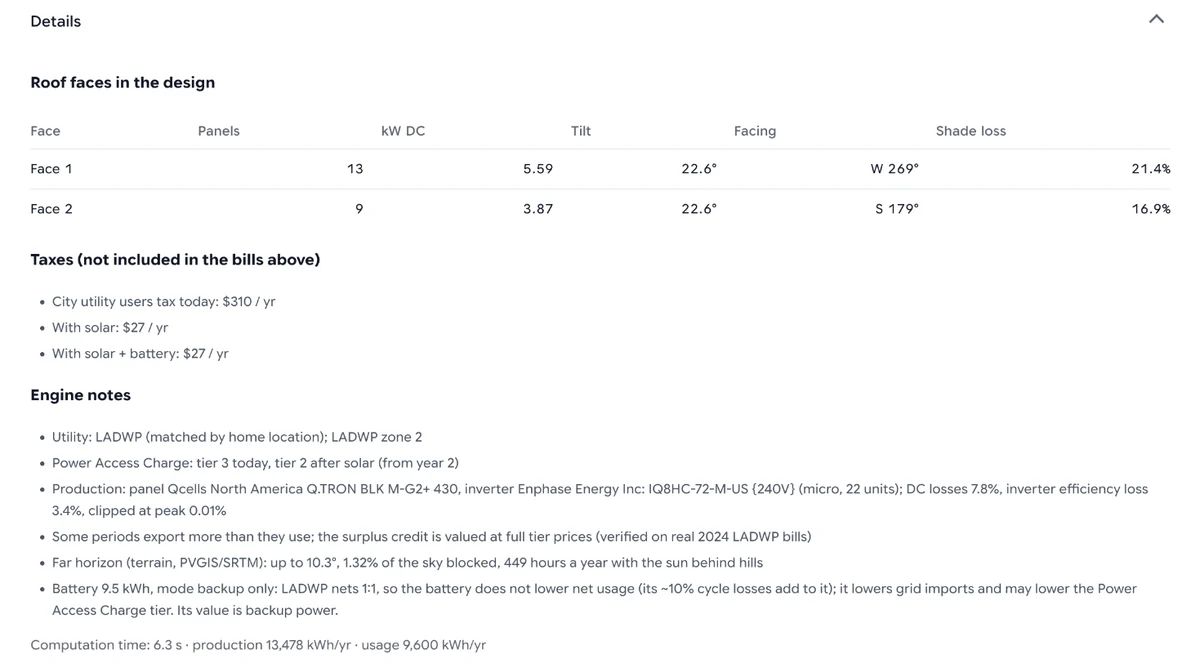
What it changes: the kilowatt-hours the system makes, hour by hour, for each roof face — after panel heating, the exact inverter's efficiency and power limit, and Cali-Graf's 7.77% real-world losses. How the pieces fit together is in hour-by-hour production per roof face.
Step 7 — The home's hourly usage
Source: the customer's own Green Button file when there is one; otherwise ResStock, NLR's hour-by-hour model of a large, representative sample of U.S. homes, using its single-family homes in Los Angeles.
What it changes: how much solar the home uses directly and what it sends to the grid — which, under SCE's Net Billing, decides the bill, because a kilowatt-hour exported at noon earns far less than one bought at 7 p.m. Without a Green Button file, Cali-Graf picks the 30 ResStock homes whose year looks most like the customer's bills, scales each to match the bills exactly and uses their middle result; for SCE homes it also shows the spread of those 30 scenarios. Time-of-use kWh from SCE bills narrow it, and for TOU-D-PRIME customers it picks similar homes with an electric car charging at night. A yearly total alone carries no shape, which is why bills give a more accurate result than one number.
Step 8 — The equipment
Source: the California Energy Commission's Solar Equipment Lists for panels, inverters and batteries, plus the manufacturers' datasheets for compatibility limits.
What it changes: power, efficiency and temperature behavior in the production model; whether the panel, inverter and battery work together (a panel's cold-morning voltage is checked at −10 °C, 14 °F); and the yearly degradation used in the 25-year forecast. The same CEC lists power Cali-Graf's public equipment directory.
Step 9 — The bill
Source: LADWP's residential rates and adjustment factors; SCE's tariff books and its export prices under the Net Billing Tariff; Clean Power Alliance's published residential rates; each city's utility users tax rate.
What it changes: the dollars. Rates are applied by billing period — six two-month LADWP periods or twelve SCE months — with each utility's credit rules. The city utility users tax is shown separately rather than hidden inside the bill. Utilities change their prices several times a year, so the same home can come out a little different later; the rate plans a calculation used are listed in Details → Engine notes under the result. Checked against real bills, Cali-Graf's engine comes within ±3 cents on LADWP and matches most SCE bills to the cent — see how accurate Cali-Graf is.
Step 10 — What isn't in the numbers
Source: the IRS page on the Residential Clean Energy Credit.
What it changes: nothing is subtracted for it. The 30% federal credit isn't available for systems placed in service after December 31, 2025, so Cali-Graf's price, payback and savings include no federal credit, and SGIP or local rebates aren't added either. Background: the 30% solar tax credit ended.
The chain at a glance
What each source changes in a Cali-Graf proposal:
| Step | Public source | What it changes |
|---|---|---|
| Address | LA County Address Points; Google Geocoding | Where the home is: utility, zone, tax, weather, imagery |
| Utility | CEC service-area map; LADWP zone table | Which rate book, tiers and baseline apply |
| Roof and shade | Google Solar API | Face pitch, direction and per-panel shade |
| Setbacks | CRC R329.6; LAFD rules | Where panels can go, how many fit |
| Weather | NSRDB (NLR) | Hourly sunlight and panel temperature |
| Production | PVWatts in SAM (NLR); CEC models | Hourly kWh per roof face |
| Hourly usage | Green Button; ResStock (NLR) | Self-use versus export — the SCE bill |
| Equipment | CEC Solar Equipment Lists; datasheets | Power, compatibility, degradation |
| Bill | LADWP, SCE, CPA rates; city tax | The dollars, by billing period |
| Tax credit | IRS | Nothing subtracted — the credit ended |
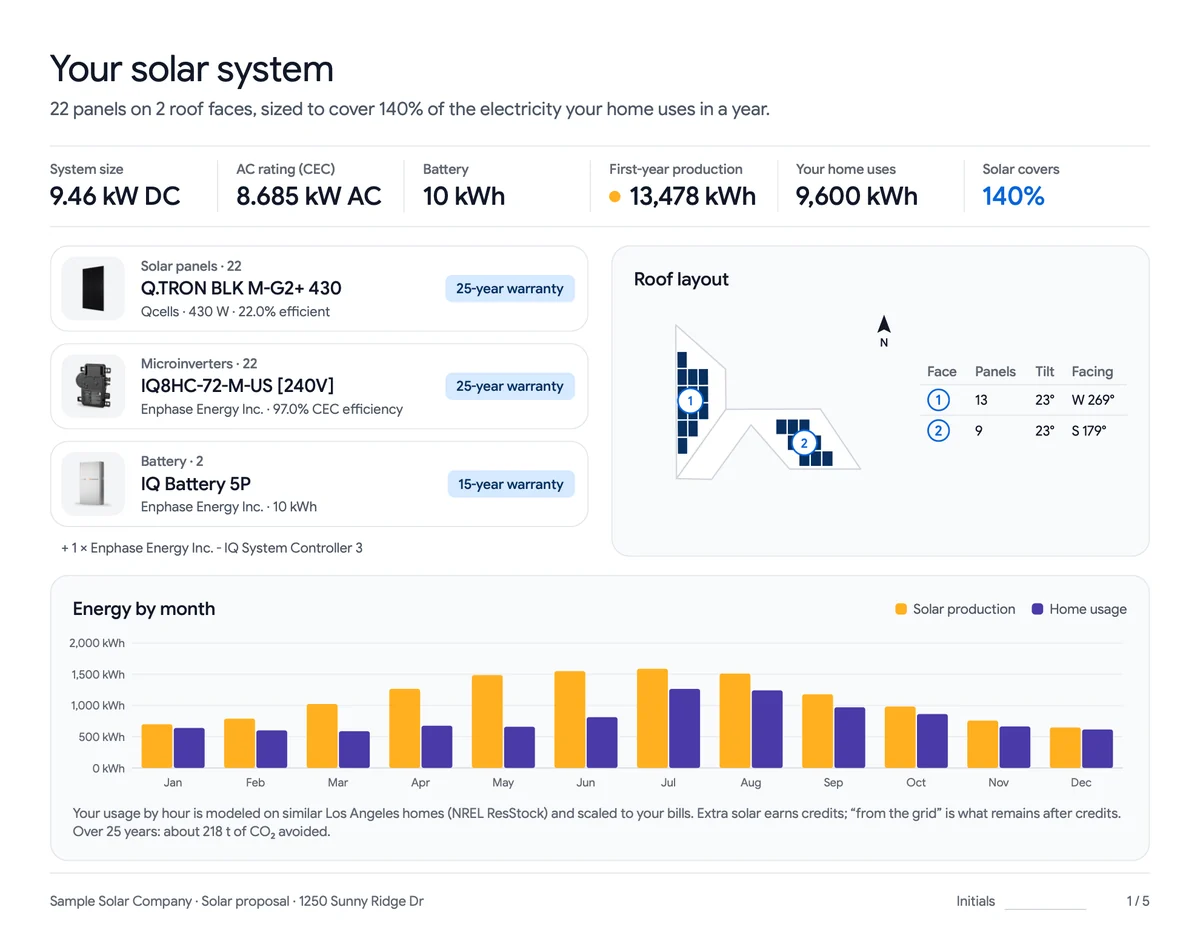
See where each number lands: open the sample proposal, then run the same chain on a customer of your own.
Frequently asked
What data does Cali-Graf use?
Where does Cali-Graf get utility rates?
How does Cali-Graf know a home's hourly usage from monthly bills?
Does Cali-Graf send a homeowner's address to weather services?
Why might the same home come out differently later?
Related reading
Sources & methodology
Product facts on this page come from Cali-Graf's own help center and the pages linked below; figures in examples come from the stated inputs. Features, limits and supported utilities change; each was verified October 16, 2026.
- Cali-Graf Help — Data sources
- Cali-Graf Help — How the hourly usage profile is built
- Cali-Graf Help — How production is calculated
- Cali-Graf Help — Supported utilities and areas
- Cali-Graf Help — Fire setbacks on the roof
- Cali-Graf — Privacy Policy (weather and terrain services)
- Google — Solar API overview
- NLR (formerly NREL) — National Solar Radiation Database
- NLR (formerly NREL) — System Advisor Model (SAM)
- NLR (formerly NREL) — ResStock
- European Commission JRC — PVGIS
- California Energy Commission — Solar Equipment Lists
- SCE — Tariff books
- IRS — Residential Clean Energy Credit
Follow the chain on a real home
Enter an address and the customer's bills, trace the roof, and every number on the proposal — from the utility line to the 25-year savings — comes from the sources above. Free in Cali-Graf, with daily fair-use limits; each source is linked on its Data sources page.
Prepared by Cali Energy, October 16, 2026. This article is for general educational purposes only and is not legal, tax, financial, engineering, or utility advice. Rates, incentives, codes, permit requirements, equipment specifications, prices, and program terms may change; figures and timelines are estimates, not guarantees. Confirm current requirements with the applicable utility, AHJ, program administrator, manufacturer, or a licensed professional. See our Content Disclaimer. Cali Energy · 19201 Parthenia St, Unit E, Northridge, CA 91324 · CSLB #1032379 (B, C-10, C-39)