

Designing a Solar Layout on Satellite Imagery: What to Trust and What to Check
A solar layout drawn on satellite imagery is good enough to price a job before anyone climbs a ladder — if the designer knows where the data is weak. In Cali-Graf — the free solar design app built by Cali Energy, a Los Angeles solar and roofing contractor — the seller traces each roof face on Google's aerial photo; Google's 3D height map gives each face its pitch and direction, finds most chimneys and vents, and works out the shade on every panel. The parts that go wrong are predictable: a pitch skewed by a tree or a sloppy outline, a small vent the heights don't show, shade from a tree that's already gone, a roof that changed after the image date. This page walks through a remote design in the order it's done, with what to trust and what to check at each step, and ends with a checklist for the site visit.
What the remote design rests on
Two layers from Google Solar sit under every design: an aerial photo at about 10 cm per pixel, covering about 70 m (230 ft) around the home, and a height map of every point of the roofs and trees. The photo is for tracing; the heights do the measuring. Both are from one date, shown in the editor's top bar with the image quality — for example Imagery Dec 2, 2023 · high quality — and anything that changed after that date isn't in either. Check the date and quality before tracing: medium or low quality means blurrier outlines and less exact heights, and an old date is the first warning that the roof, the trees or the house may have changed. What to do when they have is in old satellite imagery in solar design.
Step 1 — Trace the faces: where most errors start
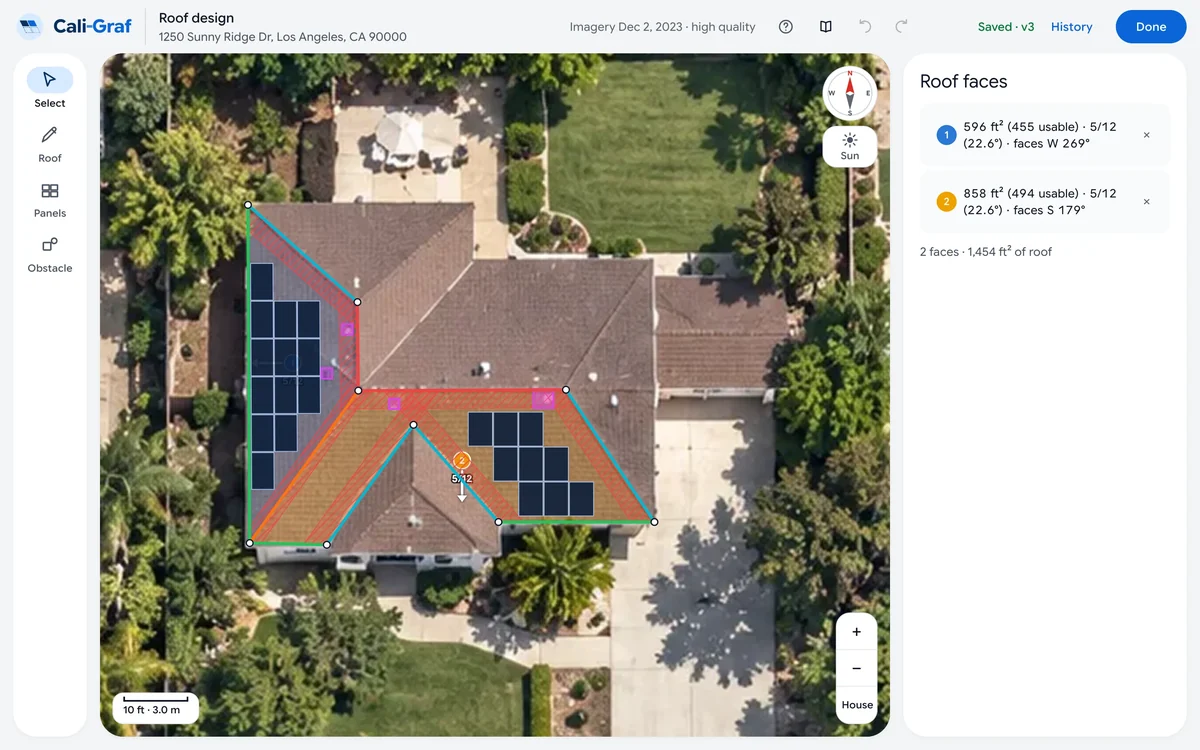
Every measurement downstream follows the outline, so the outline is where a remote design is won or lost:
- One face per plane. Pitch and direction are measured face by face, so a face that spans two slopes gets a pitch that fits neither. On a hip roof or an L-shaped house, trace the outline and split it into its real faces.
- Trace to the roof edge, overhang included, and trace the faces next to the ones that will hold panels. Shared edges decide which are ridges, hips and valleys — and with them the fire setbacks and pathways. A hip with an untraced neighbor reads as a rake and gets the wrong strip; see how Cali-Graf applies CRC R329.6 and LAFD setbacks.
- Keep the outline on the roof. An outline that runs past the roof edge takes in heights from beyond the roof and disturbs the pitch.
Step 2 — Read the measured pitch, and know when not to trust it
As soon as a face closes, Cali-Graf fits a plane through Google's height points inside it and shows the pitch as roofers write it — for example 5/12 · 22.6° — and the direction it slopes, such as S · 179°. The note under the pitch says how far to trust it:
| The note | What usually causes it | What to do |
|---|---|---|
| Measured from Google 3D heights — change it only if it looks wrong. | Nothing — the normal case | Nothing |
| Google heights are uneven on this face… | A tree over the roof, a chimney, an outline past the edge, a recent change to the house | Fix the outline; if the pitch still looks wrong, set it by hand and confirm on site |
| Google could not measure this face — pick the pitch. | A face too small or narrow to measure | Pick the pitch; confirm on site |
A pitch set by hand is marked Set by hand next to Google's value, so anyone opening the design later can see it was a judgment call. The pitch matters twice: it is the tilt of the panels, which feeds production, and faces of 2:12 or flatter don't need a fire pathway. How pitch is written and measured on a roof is explained in roof pitch explained.
Step 3 — Obstacles: the heights find most, not all
A panel can't sit on a chimney or skylight, and plumbing vents need room. Detect obstacles looks for bumps in the height map inside the traced faces and marks them in magenta; it runs on its own the first time the roof is filled. Its misses follow from how it works:
| Likely to be missed | Why |
|---|---|
| Small plumbing vents and flat roof hatches | They barely rise above the roof |
| Anything under trees or on a blurry image | The heights there show the tree, or lack detail |
| Anything added after the image date | It isn't in the data |
Zoom in and compare with the photo: delete false hits, resize real ones and draw what's missing — a single click with the circle tool places a vent pipe, and a polygon covers anything irregular. Set the clearance your crews actually leave around vents under Fire setbacks. On a real roof this step matters more often than not: Cali Energy found that about two thirds of the roofs in a sample of its own installations had a chimney, vent, skylight or rooftop unit that changed the shape of the array — see how skylights, chimneys and vents change a solar layout.
Step 4 — Decide which faces are worth panels
Direction is only half the answer. In Los Angeles a south-facing face makes the most power, west-facing faces help most in the evening and north-facing ones the least — but two faces facing the same way can differ a lot if a tree shades one of them all afternoon. The sun map shows that at a glance, coloring every part of the roof by Google's yearly sun from about 700 to 2,050 kWh per kW: yellow is the sunniest, purple is in shade or faces away.
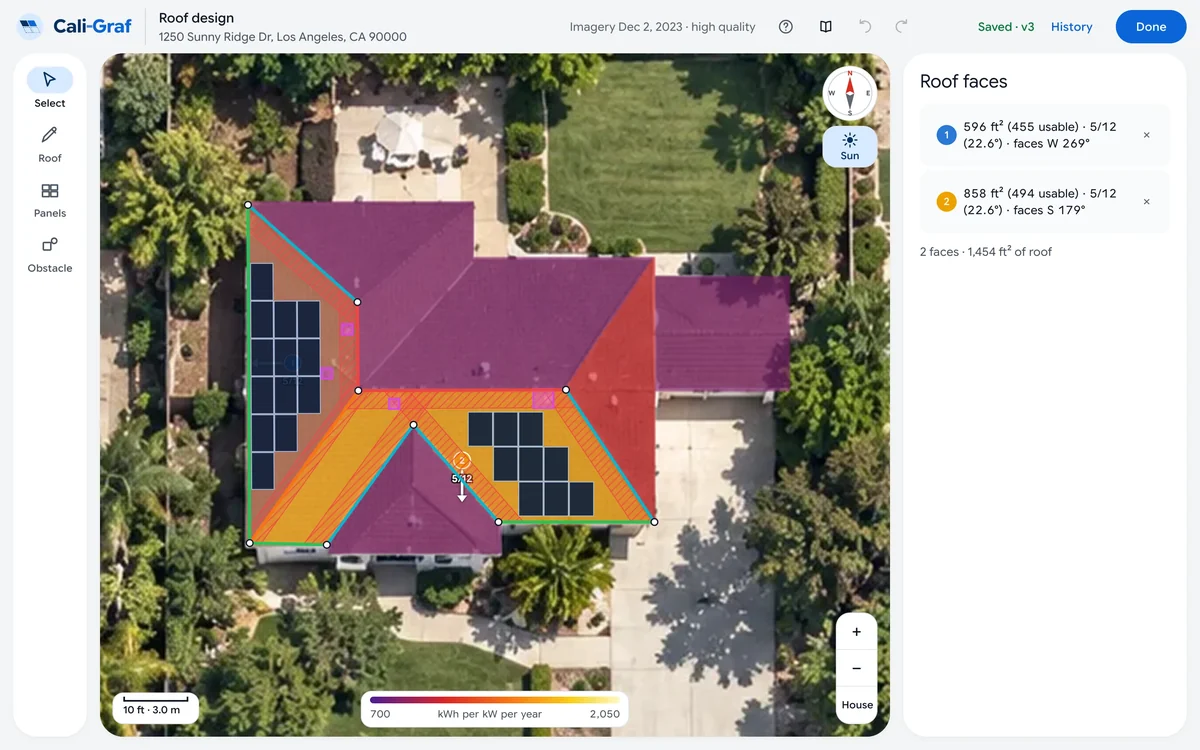
Each face also shows its own average, Sun on this face — on the demo home's south face, 1,658 kWh a year per kW. Skip parts of the roof that stay purple. Fill roof leaves north-facing faces empty; a north face can still be filled on its own when its number justifies it. Comparing east-west and south layouts in general is covered in east-west vs south-facing solar.
Step 5 — Fill, then fix what the editor flags
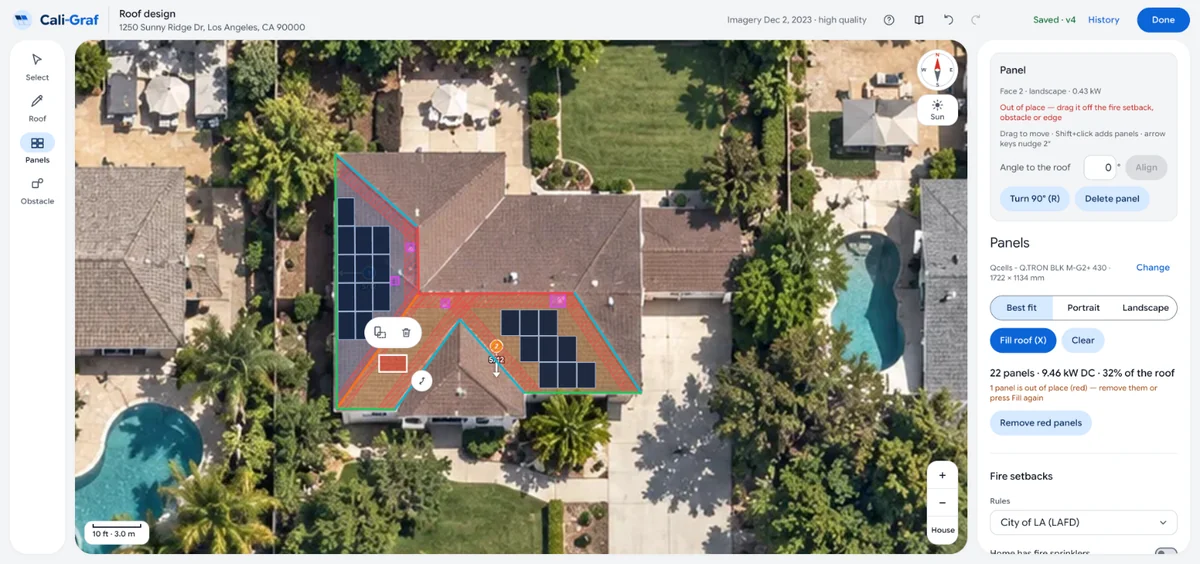
With the panel chosen first — the layout is drawn in its size — Fill roof places as many panels as fit on the non-north faces, outside the fire setbacks and around obstacles, and adds the fire pathways the roof still needs. The result card sums it up: on the demo home, 22 panels · 9.46 kW DC · 32% of the roof.
Then look for red panels. A panel turns red when it sits in a setback or pathway, on an obstacle, over the edge of its face, or was laid out for a different panel model. Red panels still count in the system size and production, so a design with red panels overstates what can be built — clear them before calculating. The same applies after any late change: a vent drawn after the fill turns the panels under it red, and a new panel model turns the old layout red until it's laid out again.
Step 6 — Shade: measured per panel, not a flat guess
The sun map is for choosing where panels go; the proposal's numbers come from a separate calculation. For every panel's spot, Cali-Graf works out when through the year trees, chimneys and nearby buildings shade it — direct sun from Google's hourly shade layers, light from the sky from the height map — and takes it out of production hour by hour. Shade analysis is on by default; turned off, a standard 3% is used instead.
The judgment call is when to turn it off. Only when the shade on the image is gone — a tree cut down, or to be cut before installation, or a structure removed. On a shaded roof a flat 3% is far less than the real loss, and production and savings come out higher than the home will see; if only part of the shade is gone, leave it on. One limit to keep in mind: each face's shade loss is averaged over its panels, which matches panels with their own microinverters or optimizers; on a string inverter without optimizers, a shaded panel can pull down more of the string than that average shows. The full production model is in hour-by-hour production per roof face.
Before the proposal, and at the site visit
| Check | In the design | At the site visit |
|---|---|---|
| Image date and quality | Top bar; old or low quality = more to verify | Has the roof, house or tree line changed since? |
| Pitch | Every face Measured, or a reason for Set by hand | Measure faces marked uneven or set by hand |
| Faces | One face per plane, neighbors traced | Overhangs, additions, a garage not on the image |
| Obstacles | Detected ones compared with the photo, small vents drawn | Vents, hatches, conduit, rooftop units |
| Red panels | None left | — |
| Shade | Shade analysis on, unless the shade is gone | Trees removed or planned to be |
| Fire rules | The right rule set for the city | Overhang depth on gables in the City of Los Angeles |
A remote design is an estimate from public data. It isn't an engineering, structural, electrical or permit design, and it doesn't replace a site visit — it makes the visit shorter and the proposal closer to what gets built.
Try the six steps on a roof you have already been on — and see what the aerial design gets right before you climb.
Frequently asked
Can you design a solar panel layout on a satellite image?
How reliable is roof pitch measured from satellite data?
Does automatic obstacle detection find every vent?
Should panels go on a north-facing roof?
When should shade analysis be turned off?
Does a remote solar design replace a site visit?
Related reading
Sources & methodology
Product facts on this page come from Cali-Graf's own help center and the pages linked below; figures in examples come from the stated inputs. Features, limits and supported utilities change; each was verified October 16, 2026.
- Cali-Graf Help — Roof editor overview
- Cali-Graf Help — Aerial image and height data
- Cali-Graf Help — Draw roof faces
- Cali-Graf Help — Roof pitch: measured or set by hand
- Cali-Graf Help — Detect obstacles automatically
- Cali-Graf Help — Sun map
- Cali-Graf Help — Fill the roof with panels
- Cali-Graf Help — Why panels turn red
- Cali-Graf Help — Turn shade analysis on or off
- Cali-Graf — Terms of Service
- Google — Solar API data layers
Design your next roof from the office
Trace the faces, check the measured pitch, let Fill roof respect the setbacks and obstacles, and walk into the site visit with a short list of what to confirm. Free in Cali-Graf, with daily fair-use limits; button-by-button steps are in its help center.
Prepared by Cali Energy, October 16, 2026. This article is for general educational purposes only and is not legal, tax, financial, engineering, or utility advice. Rates, incentives, codes, permit requirements, equipment specifications, prices, and program terms may change; figures and timelines are estimates, not guarantees. Confirm current requirements with the applicable utility, AHJ, program administrator, manufacturer, or a licensed professional. See our Content Disclaimer. Cali Energy · 19201 Parthenia St, Unit E, Northridge, CA 91324 · CSLB #1032379 (B, C-10, C-39)