

The Price of Solar: 15+ Years of Cost Data
Straight from the data: NREL’s benchmark for a U.S. home solar system fell from $9.23 per watt in 2010 to $3.25 in 2024, in 2024 dollars — a 65% drop — and to $2.95 in early 2025, while the panels themselves fell about 90%. Then the decline stalled. In California’s own records, homeowners paid a median of about $4.10–4.30 a watt for a solar-only system every year from 2020 to 2024 — until 2026, when the median dropped to $3.23, the same year the federal tax credit ended for homeowners.
Get a free estimate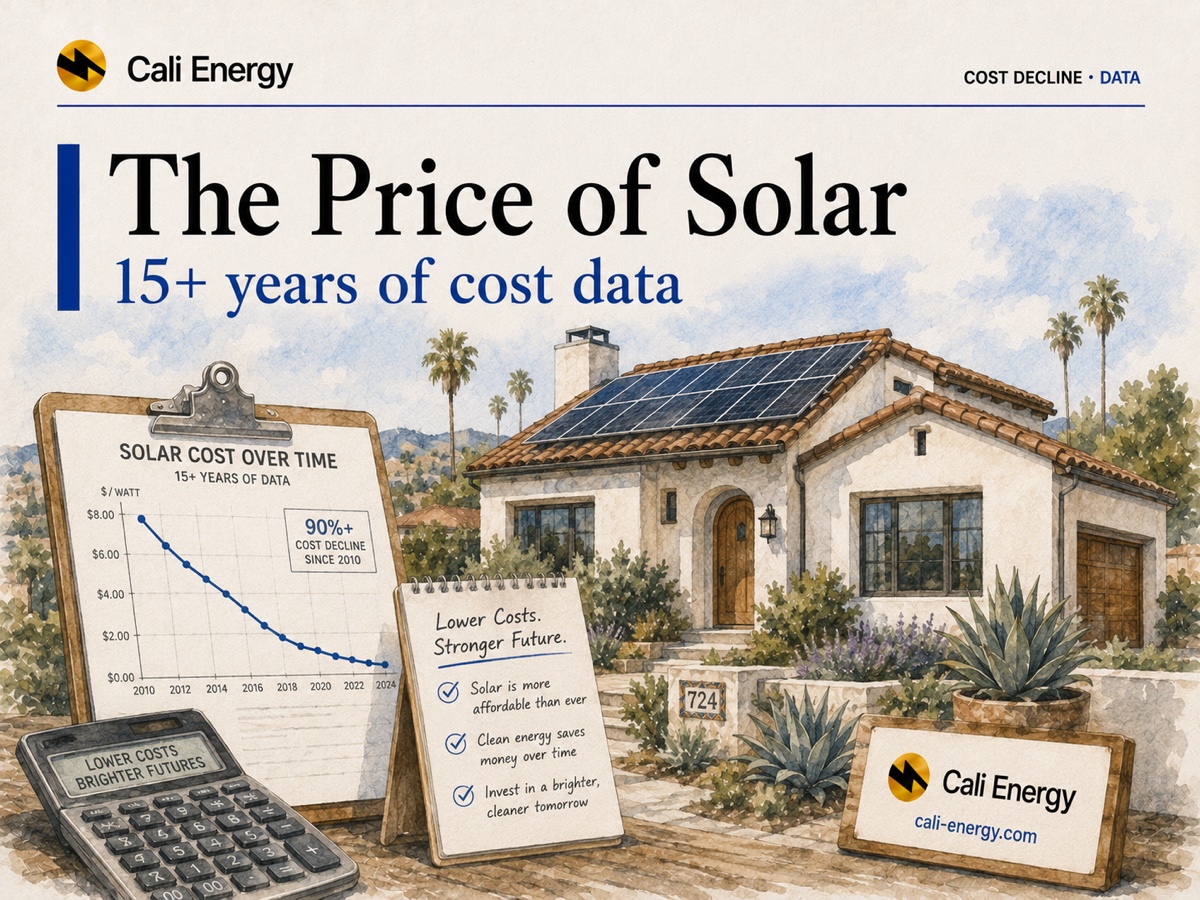
- A 65% fall: NREL’s home solar benchmark went from $9.23 a watt in 2010 to $3.25 in 2024 (2024 dollars), and to $2.95 in the first quarter of 2025.
- Panels got cheap; everything else less so: the module fell from $3.28 to $0.40 a watt; soft costs — sales, permits, overhead — are now half the benchmark.
- The stall: NREL finds costs roughly flat from 2021 to 2024, citing supply chains and labor shortages.
- What Californians paid: a median $4.10–4.28 a watt for solar-only systems from 2020 to 2024, $4.01 in 2025 and $3.23 so far in 2026; with a battery, about $4.80–5.40.
- The 2026 twist: the sticker price fell, but without the 30% federal credit the net cost of a typical system is higher than in 2025.
Before 2010: what homeowners paid
The longest record of real prices is Berkeley Lab’s Tracking the Sun, built from state incentive and interconnection data. Its 2016 edition put the median installed price of a U.S. home system at $4.1 a watt in 2015, in 2015 dollars, after a decline of about $8.3 a watt since 1998 — so roughly $12.4 a watt in 1998. Module prices accounted for $4.4 of that drop and everything else for $3.9, and median prices fell 6–12% a year on average over 1998–2015 (Berkeley Lab, Tracking the Sun IX). The same report found German home systems at about $1.7 a watt in 2015, with the difference mostly in soft costs.
Solar cost over time: the national benchmark
| Year | Installed cost |
|---|---|
| 2010 | $9.23 |
| 2011 | $8.12 |
| 2012 | $5.73 |
| 2013 | $5.02 |
| 2014 | $4.42 |
| 2015 | $4.13 |
| 2016 | $3.87 |
| 2017 | $3.61 |
| 2018 | $3.42 |
| 2019 | $3.40 |
| 2020 | $3.33 |
| 2021 | $3.22 |
| 2022 | $3.41 |
| 2023 | $2.87 |
| 2024 | $3.25 |
| Q1 2025 | $2.95 |
Sources: NREL, Documenting 15 Years of Reductions in U.S. Solar, Table A-6 (the 2010–2014 benchmarks were collected in the fourth quarter of the previous year) · DOE/NREL cost benchmarks for Q1 2025.
The benchmark is an engineering model of a typical system, not a survey of prices paid. It fell fast through 2012 and steadily through 2021. From 2021 to 2024 it was roughly flat, and in some years it rose; NREL attributes part of that to supply-chain disruptions and labor shortages after the pandemic, and part to changes in its own modeling. Over the same 2020–2024 period, the benchmark for a home system with a battery fell 20% (NREL).
Where the money goes now
The panel is the cheap part.
| Component | 2010 | 2024 |
|---|---|---|
| Module | $3.28 | $0.40 |
| Inverter | $0.59 | $0.37 |
| Racking and electrical (BOS) | $0.71 | $0.62 |
| Installation labor | $1.43 | $0.21 |
| Soft costs (sales, permits, overhead, profit) | $3.22 | $1.64 |
| Total | $9.23 | $3.25 |
Source: NREL, Table A-5.
The module fell 88%, from $3.28 to $0.40 a watt, and went from 36% of the benchmark to 12%. Soft costs — customer acquisition, permitting, inspection, interconnection, overhead and profit — fell by about half but are now half of the total. That is why two quotes with the same panels can differ so much, and why a cheaper panel moves the price far less than a different installer; see how to compare solar quotes.
Panels also got better. NREL’s benchmark home system used multicrystalline modules of 14.5–17.2% efficiency through 2018, switched to monocrystalline PERC in 2019 and reached 21.1% by 2024, while the modeled system grew from 5.0 to 7.9 kW (NREL). More watts per panel means fewer panels, less racking and less labor for the same output.
What Californians actually paid, 2020–2026
| Year approved | Solar only | With a battery | Los Angeles County, solar only (SCE) |
|---|---|---|---|
| 2020 | $4.14 | $5.10 | $3.91 |
| 2021 | $4.10 | $4.76 | $3.94 |
| 2022 | $4.25 | $4.92 | $4.20 |
| 2023 | $4.25 | $5.00 | $4.25 |
| 2024 | $4.28 | $5.42 | $4.17 |
| 2025 | $4.01 | $4.98 | $3.65 |
| 2026 (Jan–Aug) | $3.23 | $5.10 | $3.24 |
Source: CPUC California DG Stats, Interconnected Project Sites, data through August 31, 2026; Cali Energy medians of reported total system cost divided by DC size, excluding leases and PPAs and obvious data-entry errors. SDG&E’s file has no battery data and is left out.
Real prices sit well above the model: Berkeley Lab’s California median for solar-only, homeowner-owned systems installed in 2024 was $4.00 a watt against NREL’s $3.25 (Berkeley Lab; solar panel cost in 2026). In the state’s records the solar-only median held at $4.10–4.28 from 2020 to 2024. It then fell in both utilities’ territories from mid-2025 — in SCE’s, from $4.19 in early 2025 to about $3.10 in 2026. The records show what was reported, not why; the drop coincides with the end of the federal credit. Systems with a battery have stayed around $5 a watt.
Lower sticker, higher net cost
Expenditures after December 31, 2025 no longer qualify for the 30% Residential Clean Energy Credit (IRS). Take the state’s medians: $4.01 a watt in 2025 was about $2.81 after a 30% credit, while $3.23 in 2026 has no credit. The sticker fell 19%, but the net cost to a homeowner who could use the full credit rose about 15%. Cali Energy arithmetic from the medians above, not tax advice; see the federal credit that ended.
What this means for a buyer
Don’t wait for cheaper panels
The module is already 12% of the benchmark; even free panels would not halve a price.
Compare per watt
Divide a quote by its DC size and compare it with the medians above, solar-only or with a battery.
Watch the soft costs
Sales and financing are where prices differ most; see solar loan dealer fees.
Value beats price
Whether solar pays depends on your bill and your utility; see is solar worth it.
Where to go next
Cali Energy is a licensed Los Angeles solar, battery and electrical contractor (CSLB #1032379). We give an itemized quote with the price per watt shown, so you can compare it with the data above. Call +1-323-844-7777 or get an itemized quote.
Frequently asked
How much have solar prices dropped?
NREL’s benchmark for a U.S. home system fell 65%, from $9.23 a watt in 2010 to $3.25 in 2024 in 2024 dollars, and was $2.95 in early 2025. The module fell about 90%. In California’s records, the median solar-only price was $4.10–4.28 a watt from 2020 to 2024 and $3.23 in January–August 2026.
Why did solar stop getting cheaper so fast?
The hardware is already cheap; most of the price is now soft costs such as sales, permitting and overhead. NREL found costs roughly flat from 2021 to 2024 and points to supply-chain disruptions and labor shortages after the pandemic.
Now that the federal tax credit ended, is solar more expensive?
The sticker price is lower, but the net cost is higher for anyone who could have used the credit. California’s median fell from $4.01 a watt in 2025 to $3.23 in 2026, but $4.01 minus a 30% credit was about $2.81 — so the net cost rose about 15%.
Is the panel really the cheapest part?
Close to it. In NREL’s 2024 benchmark the module is $0.40 of $3.25 a watt, 12%. Soft costs are $1.64, about half.
What does solar cost per watt in California in 2026?
In state interconnection records for PG&E and SCE, homeowner-owned solar-only systems approved in January–August 2026 had a median of $3.23 a watt DC, and systems with a battery about $5.10. Your own price depends on the roof, equipment and installer.
Related reading
Sources & methodology
Figures on this page come from the primary sources below and, where noted, from Cali Energy calculations using the stated assumptions. Rates, incentives, and program terms change; each was verified October 5, 2026.
- NREL — Documenting 15 Years of Reductions in U.S. Solar (benchmarks 2010–2024, Tables A-5 and A-6)
- DOE / NREL — Solar Photovoltaic System Cost Benchmarks (Q1 2025)
- Berkeley Lab — Tracking the Sun IX (2016 edition): installed prices 1998–2015
- Berkeley Lab — Tracking the Sun / U.S. Distributed Solar and Storage, 2025 data update
- CPUC — California DG Stats, Interconnected Project Sites (data through August 31, 2026; Cali Energy medians)
- IRS — Residential Clean Energy Credit
See where prices sit today
Send us your roof and a recent bill and we’ll give you an itemized quote with the price per watt, so you can compare it with the market. Estimates, not guarantees.
Get a free estimatePrepared by Cali Energy, October 5, 2026. This article is for general educational purposes only and is not legal, tax, financial, engineering, or utility advice. Rates, incentives, codes, permit requirements, equipment specifications, prices, and program terms may change; figures and timelines are estimates, not guarantees. Confirm current requirements with the applicable utility, AHJ, program administrator, manufacturer, or a licensed professional. See our Content Disclaimer. Cali Energy · 19201 Parthenia St, Unit E, Northridge, CA 91324 · CSLB #1032379 (B, C-10, C-39)