

How Much Do Solar Panels Cost in California in 2026?
Straight answer: about $4.00 per DC watt before incentives — that is the median Californians paid for a stand-alone, homeowner-bought system installed in 2024, in the national-lab records of real installations. The federal government’s own modeled benchmark for the same year was $3.25 per watt, and its newest is $2.95. That gap between the model and the market is most of what this page is about. Below: where a quote of your own sits in the real distribution, what the panel actually costs, and how to read the disclosure California law puts on your contract.
Get a free estimate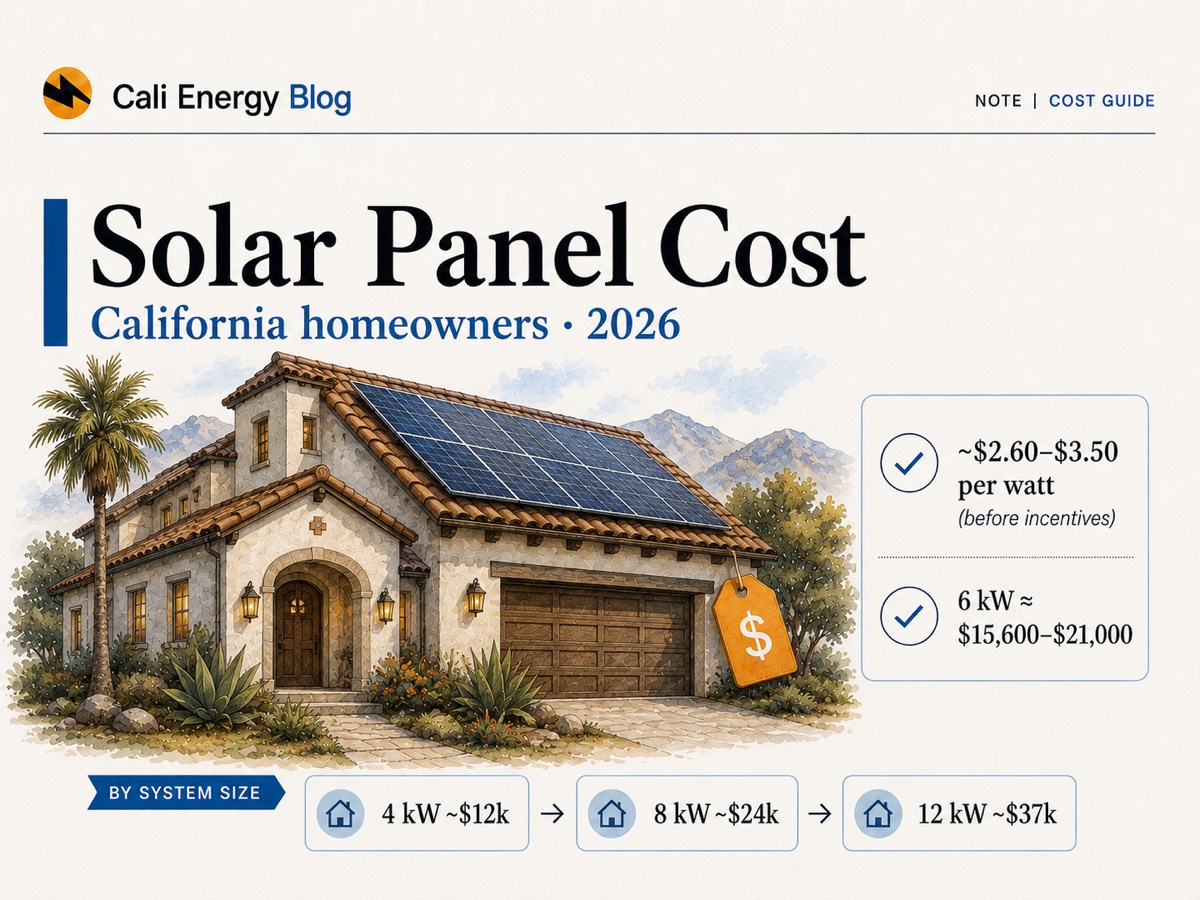
- The two records of what people actually paid land within a few percent of each other once the units are matched. Berkeley Lab’s California median is $4.00 per DC watt for 2024 installs; California’s interconnection records average $4.74 per CEC-AC watt for the same year, or roughly $4.10–$4.20 per DC watt. They are not the same population — the state record includes battery-paired systems and Berkeley Lab’s excludes them, which is consistent with the state figure sitting higher.
- NREL’s modeled benchmark sits below both: $3.25 per DC watt for Q1 2024, the year matching the installation data, and $2.95 for Q1 2025. It is an engineering model of one representative system, not a survey of what anyone paid.
- The useful number is a distribution, not an average. Across the US, the middle 60% of stand-alone residential systems installed in 2024 fell between $3.00 and $5.20 per DC watt before incentives, and median prices across the hundred largest US installers ran from $2.70 to $6.50.
- Who you buy from moves the price most; how you pay moves it next — across the US the median cash system cost $3.50/W against $4.70/W financed. Judge a cash quote against the cash median, not the blended one.
- In NREL’s Q1 2024 modeled breakdown the panel is about 12% of the price and soft costs about half.
- The 30% federal credit is gone for systems whose installation finished after December 31, 2025, so there is no federal residential credit to subtract from a 2026 price. State and utility programs are separate.
The model says $3.25. The market says $4.00.
Three official bodies publish a residential solar price. Two measure what people paid and land close together; the third models what a system ought to cost. Almost every confusing number in circulation comes from mixing the two kinds, or from mixing the units they are quoted in.
| Source | As published | On a DC-watt basis | What it is | Basis |
|---|---|---|---|---|
| NREL / US Dept. of Energy PV cost benchmark, Q1 2025 | $3.25/W-DC (Q1 2024) $2.95 in Q1 2025; $4.59 with a 13.5 kWh battery | $3.25 | A bottom-up engineering model of what one representative 8 kW system should cost to build and sell | Modeled, national, gross of incentives; excludes financing costs and roof work |
| Berkeley Lab (LBNL) U.S. Distributed Solar and Storage, Oct 2025 | $4.00/W-DC California median, 2024 installs | $4.00 | Price reported by the installer or customer, from state incentive and interconnection program records | Median, gross of incentives, host-owned and stand-alone only — excludes leases, self-installs and PV paired with a battery |
| CPUC / California DG Stats Interconnection records | $4.74/W-AC 2024; $5.11 in 2025; $4.71 for Jan–May 2026 | ≈ $4.10–$4.20 2024; ≈ $4.40–$4.50 for 2025, ≈ $4.05–$4.15 for early 2026 | Cost as reported by the applicant on every residential interconnection under 10 kW in SCE, PG&E and SDG&E territory, including systems paired with a battery | Mean, per CEC-AC watt, self-reported and unverified |
The unit conversion is the step most comparisons skip, and it is easy to get wrong. CPUC states system size as CEC-AC — the PTC rating of the modules multiplied by inverter efficiency — which runs roughly 0.86 to 0.88 of DC nameplate. That puts the 2024 mean of $4.74/W-AC at about $4.10 to $4.20 per DC watt, a few percent above Berkeley Lab’s $4.00/W-DC median rather than below it. The residual is consistent with the populations: the state series includes battery-paired systems, which Berkeley Lab’s median excludes, and it is a mean where Berkeley Lab reports a median. Both are reported by the installer or customer rather than audited. The genuine outlier is the model. Sources: DOE/NREL cost benchmark · Berkeley Lab, U.S. Distributed Solar and Storage 2025 Data Update · California DG Stats, cost per watt.
Two scope notes carry through the whole page. First, Berkeley Lab’s median covers stand-alone systems bought outright — no leases, no self-installs, no battery. Since most new California systems now include storage, that median describes a minority of the market and is the right yardstick only for a solar-only, homeowner-bought quote.
Second, the CPUC interconnection data covers the three investor-owned utilities only. A home on LADWP, Burbank or Glendale is not in that record — municipal utilities report aggregate totals rather than per-project cost — so those figures describe SCE, PG&E and SDG&E territory.
Where a quote sits in the real range
An average tells you nothing about whether your own quote is fair. A distribution does.
Among US residential systems installed in 2024 — stand-alone, bought outright, no battery — Berkeley Lab reports the 20th percentile at $3.00/W, the median at $4.00/W and the 80th percentile at $5.20/W, all per DC watt and before any incentives. California’s median is $4.00/W as well — the state is, in Berkeley Lab’s words, “near the middle of the pack.” It does not publish percentiles for California separately, so the outer two markers below are national.
The spread between companies is wider than most homeowners expect. Across the hundred largest residential installers in the US in 2024, median prices ran from $2.70 to $6.50 per watt. That is roughly three times the gap between paying cash and financing, which makes who you buy from the largest single lever on the price. Two quotes for the same roof and the same panels can differ by a factor of two, and both companies stay in business.
| System size (DC) | Panels at 400 W | At $3.00/W 20th percentile, US | At $4.00/W median, California and US | At $5.20/W 80th percentile, US |
|---|---|---|---|---|
| 4 kW | 10 | $12,000 | $16,000 | $20,800 |
| 5.7 kW California’s median system size | ~14 | $17,100 | $22,800 | $29,640 |
| 8 kW | 20 | $24,000 | $32,000 | $41,600 |
| 10 kW | 25 | $30,000 | $40,000 | $52,000 |
| 12 kW | 30 | $36,000 | $48,000 | $62,400 |
Each cell is the system size multiplied by that price per DC watt, held flat across sizes. Real prices are not flat: Berkeley Lab measured roughly $1.00/W between the smallest and largest residential systems in its 2023 data, so the 10–12 kW rows likely run high and the 4 kW row low. The 5.7 kW row is closest to the size the California median was drawn from — that was the median California system installed in 2024, against 7.2 kW nationally. A quote that includes a battery, a main-panel upgrade or roof work is not comparable to these figures at all.
After the installer, how you pay moves the price most
It is not the equipment. It is cash versus a loan.
Berkeley Lab separates the two. Among 2024 US residential installations the median cash-purchase price was $3.50 per watt and the median loan-financed price was $4.70 per watt — $1.20 apart, or roughly $7,200 on a 6 kW system. Those two medians are also the right yardsticks to judge a quote by: measure a cash offer against $3.50, not against the blended $4.00. The gap has grown from $0.60/W in 2017. Berkeley Lab attributes it “partly to the loan fees rolled into the up-front price,” and cautions that not all of it is dealer fees: it does not adjust the two medians for system size, equipment or installer, and cash and financed buyers are not identical populations.
The federal consumer regulator has looked at the fees themselves. The Consumer Financial Protection Bureau reports that hidden fees in solar lending “typically range from between 10 to 30 percent of the cash price but can exceed 50 percent.”
None of that makes a loan the wrong choice. It means the comparison has to be made on the cash price of each offer, because a monthly payment can carry a fee that a monthly figure will never reveal.
What you are actually paying for
NREL publishes its benchmark component by component. The panel is a far smaller line than most people expect — smaller than the racking and wiring around it.
| Component | $/W-DC | Share | What it covers |
|---|---|---|---|
| Soft costs | $1.64 | 50% | Permitting, inspection and interconnection, sales and marketing, overhead, profit |
| Balance of system | $0.62 | 19% | Racking, wiring, conduit, disconnects, hardware |
| Module | $0.40 | 12% | The solar panels themselves |
| Inverter | $0.37 | 11% | String inverter or microinverters |
| Labor | $0.21 | 6% | Installation crew on the roof |
| Total | $3.25 | 100% | Benchmark residential system |
This breakdown is NREL’s Q1 2024 benchmark, the most recent one published component by component; the $2.95/W headline elsewhere on this page is the newer Q1 2025 total. Components are published rounded to the cent and sum to $3.24 against a published total of $3.25. Shares are of the published $3.25 total and are rounded, so the column sums to 98%. Berkeley Lab arrives at a similar place from observed prices, by a different boundary: everything other than the modules and the inverter — soft costs, balance of system and labor — is $2.47 of NREL’s $3.25, or 76%, against the “roughly 80%” Berkeley Lab reports for that bucket in observed prices.
This is why two quotes for identical panels differ by thousands. The hardware is close to a commodity and costs every installer about the same. What varies is the half of the price that is customer acquisition, overhead and margin — and, on a financed deal, the fee folded into the sticker.
Place your own system in the range
Enter your usage or a system size. The estimator sizes the array from Los Angeles production data and prices it against Berkeley Lab’s California median, with the 20th and 80th percentiles of its national residential distribution as low and high markers.
Sizing uses 1,700 kWh of AC output per kW of DC nameplate per year, which is what NREL’s PVWatts returns for a south-facing roof at 20° tilt in the San Fernando Valley with standard 14% system losses. An east-facing roof returns about 1,450 and a west-facing roof about 1,490, so the same annual output needs roughly 17% more array facing east and 14% more facing west. PVWatts models a typical meteorological year and the first year of operation, with no shading from your own trees or neighbors. Prices are for a solar-only system with no battery, and the distribution covers cash and financed systems together; a cash offer is better judged against Berkeley Lab’s cash median of about $3.50/W.
What a battery adds — and why most Californians now buy one
Berkeley Lab records California residential storage attachment rising from 14% of new installs in 2023 to 57% in 2024 — against 5% to 8% across all other states combined. Under NEM 3.0 the battery is no longer an accessory.
Three sources bracket the cost, and they do not fully agree because they count different things. NREL benchmarks the same 8 kW system twice: $2.95/W-DC alone and $4.59/W-DC with a 13.5 kWh battery, a difference of about $13,100 for that fixed battery. California’s SGIP records give a median total eligible cost of $16,981 for a residential storage project in program year 2023 and $15,096 in 2024, on a median battery of about 13 kWh. Berkeley Lab reports that the median cash price of a paired residential system in 2024 ran $1.70 per watt of PV above a stand-alone one — a premium that scales with the array, not with the battery, so on California’s median 5.7 kW system it is about $9,700.
Taken together they put a home battery somewhere between roughly $10,000 and $17,000 installed before any incentive, with the spread reflecting which costs each source counts rather than real disagreement about hardware. Whether SGIP money is available to you is a separate question — most budgets are closed, and our SGIP guide carries the live status.
This matters for benchmarking as much as for budgeting. Berkeley Lab’s $4.00/W median excludes paired systems, so a quote that includes storage cannot be measured against it, and the $1.70/W paired premium is expressed per watt of PV — it scales with the array rather than the battery, so it overstates the battery badly on a large system. The practical answer is to have the battery quoted as its own line, compare that line against the $10,000–$17,000 range above, and compare the solar half against the per-watt distribution on its own.
The 2026 change: the 30% credit is gone
Through 2025 the federal Residential Clean Energy Credit (Section 25D) took 30% off the price of a system the homeowner bought. Public Law 119-21 ended it: the credit does not apply to expenditures made after December 31, 2025, and the IRS treats the expenditure as made when the original installation is completed. A system finished in 2026 receives no federal residential credit, whether paid in cash or on a loan — so there is no federal credit left to subtract from a quoted price. State and utility programs are separate: SGIP for storage is described above, and California’s property-tax exclusion for active solar still applies to systems completed before January 1, 2027.
Under a lease or power-purchase agreement the panels belong to a third party, so the homeowner never claimed the residential credit — the IRS has held since Notice 2013-70 that a taxpayer must purchase the property to claim it. The third-party owner may still be able to claim a business investment credit, which is one reason leases and PPAs have become relatively more attractive now that the homeowner’s own credit has ended. Whether that benefit reaches the customer depends on how the agreement is priced. Our guide to the credit’s end covers what carried forward.
Watch for prices still quoted net of the residential credit. Several widely-read cost pages continue to show California prices with 30% already subtracted, which makes a 2026 system look thousands of dollars cheaper than it can be.
What’s usually included — and what costs extra
| Usually included | Usually extra |
|---|---|
| Solar panels | Home battery |
| Inverter (string or microinverters) | Main-panel (service) upgrade |
| Racking & mounting | Roof replacement or repair |
| Standard permit & interconnection | Structural reinforcement |
| Installation labor | Dealer / loan financing fees |
The right-hand column is what makes a quote incomparable to the benchmarks. NREL’s $2.95/W model excludes financing costs and roof work; Berkeley Lab’s observed prices exclude batteries. Strip both columns’ extras out before comparing anything.
Use the cash price, not the number on the disclosure
Under Business and Professions Code § 7169, every residential solar contract in California carries a one-page Solar Energy System Disclosure Document on its cover. It states the total cost and payments for the system, including financing costs, where to direct a complaint, and — if the contract was not negotiated at the contractor’s own place of business — a right to cancel, three business days, or five business days for a buyer aged 65 or over. A contract signed at the contractor’s office does not carry that right.
That page is the best thing in the transaction for spotting a financed markup, because it forces the financed total into the open. But do not divide it by watts. It includes interest, so it is not the same kind of number as the benchmarks above. An 8 kW system priced at the California median is $32,000; financed at 6.99% over 25 years the disclosure total is about $67,800, which works out to $8.47 per watt — a figure that would make an ordinary quote look outrageous.
So do this instead. Ask in writing for the cash price of the identical system, with any battery, main-panel upgrade and roof work listed separately. Divide the solar half of that cash price by the system size in DC watts, with the battery and any electrical or roof work kept out. Compare the result against Berkeley Lab’s cash median of about $3.50/W — the $3.00 to $5.20 spread covers cash and financed systems together, so it is the wider context, not the yardstick for a cash offer. Then price the battery line separately, and read the disclosure total to see what the financing itself costs you.
Since November 1, 2025, applications in the CPUC-regulated utilities — PG&E, SCE, SDG&E, Liberty, Pacific Power and Bear Valley — must also carry the disclosure completed with standardized bill-savings assumptions, plus a Solar Energy System Supporting Information form, under CPUC Resolution E-5364. LADWP, Burbank and Glendale are not CPUC-regulated and do not require them.
What moves your own price up or down
Which company you use
The largest single lever. Median prices across the hundred largest US residential installers in 2024 ran from $2.70 to $6.50 per watt — a wider spread than financing, size and equipment put together.
How you pay
Across the US the median cash system cost $3.50/W against $4.70/W financed in 2024. Ask for the cash price of every offer, whatever you end up choosing.
System size
Larger systems cost less per watt, but less than people assume. Across 2023 US installations Berkeley Lab measured roughly $1.00/W from the smallest residential systems to the largest, and the 2–7 kW bins all sat within a dime of each other.
Roof type & complexity
Clay or concrete tile, steep pitches, multiple planes and older roofs all raise labor. A simple composition-shingle roof is the cheapest to mount on.
Orientation
Not a price driver but a size driver. A west-facing roof in the Valley yields about 1,490 kWh per kW against 1,700 facing south, so it needs about 14% more array for the same output; east-facing needs about 17% more.
Battery and electrical work
Storage moves the modeled benchmark from $2.95 to $4.59 per watt. An older main panel may need upgrading first. Both belong in the quote as their own lines, not buried in a per-watt figure.
Cash, loan or lease: same panels, different total
Cash carries the lowest sticker in the data: the median cash system cost $1.20 per watt less than the median financed one. A solar loan spreads the payment but adds interest and, often, a dealer fee inside the price. A lease or PPA needs little up front and the third-party owner may still claim a business credit the homeowner no longer can — but the panels are not yours, payments usually escalate, and the agreement has to be handed over when the house is sold. Whether solar pays off at all depends on your bill and your utility, which we work through in is solar still worth it in California.
Frequently asked
How much do solar panels cost in California in 2026?
The best-evidenced answer is about $4.00 per DC watt before incentives. That is Berkeley Lab's median for stand-alone, homeowner-bought California systems installed in 2024 — the most recent installation year in its published data. California's own interconnection records land close: a mean of $4.74 per CEC-AC watt for 2024, which is roughly $4.10–$4.20 per DC watt, and that series includes battery-paired systems where Berkeley Lab's median does not. The state series then reads $5.11/W-AC for 2025 and $4.71 for January through May 2026. NREL's bottom-up model of a representative 8 kW system was $3.25 per DC watt for Q1 2024 and $2.95 for Q1 2025 — below what the market records show. At the observed 2024 median a 6 kW solar-only array is about $24,000, and with the federal credit gone there is no longer a 30% deduction to apply to it.
How much do solar panels cost in Los Angeles specifically?
No official source publishes a Los Angeles price on its own, and the per-project records that exist under-cover the city. California's interconnection cost data covers the three investor-owned utilities — SCE, PG&E and SDG&E — so a home on LADWP, Burbank or Glendale does not appear in it; municipal utilities report aggregate totals instead. The statewide figures are the closest sourced answer. What is specific to Los Angeles is production rather than price: NREL's PVWatts returns about 1,700 kWh per kW of DC capacity per year for a south-facing roof at 20° tilt in the San Fernando Valley, which is high by national standards and means a smaller array covers the same bill.
What is a good price per watt for solar in California?
Judge it against the right yardstick for how you are paying. For a solar-only system bought outright, Berkeley Lab's US cash-purchase median for 2024 installs was about $3.50 per DC watt; the median financed system was $4.70. The wider distribution — 20th percentile $3.00, median $4.00, 80th percentile $5.20 — blends cash and financed systems, so it is context rather than a test. All of it is per DC watt, before incentives, and for systems with no battery. Price a battery, a main-panel upgrade or roof work as separate lines and compare them separately.
Why are some solar quotes thousands of dollars higher than others?
Mostly because of which company you are talking to and how the deal is financed, not what goes on the roof. Median prices across the hundred largest US residential installers in 2024 ran from $2.70 to $6.50 per watt. On top of that, Berkeley Lab found the median loan-financed system cost $4.70 per watt against $3.50 for cash, attributing the gap partly to loan fees rolled into the up-front price. The Consumer Financial Protection Bureau reports hidden fees in solar lending “typically range from between 10 to 30 percent of the cash price but can exceed 50 percent.” And in NREL's modeled breakdown roughly half the price is soft costs — sales, overhead and margin — which vary far more between companies than hardware does.
How much of the price is the solar panel itself?
About 12%, on NREL's Q1 2024 modeled benchmark — the most recent one published component by component. Of $3.25 per DC watt, the module is $0.40, the inverter $0.37, balance-of-system hardware $0.62, installation labor $0.21, and soft costs $1.64. The panel is a much smaller line than most people expect — smaller than the racking and wiring around it — which is why upgrading to premium modules changes the total less than the sales pitch implies. Note this is a model of a representative system, not a measurement of California prices.
Does a bigger solar system cost less per watt?
Yes, but the effect is modest in residential. Across 2023 US installations Berkeley Lab measured roughly $1.00 per watt between the smallest and largest residential systems, and the gradient is not smooth — the bins from 2 to 7 kW all sat within about a dime of each other. Commercial solar shows far stronger economies of scale.
How much does adding a battery cost?
Roughly $10,000 to $17,000 installed before any incentive, on three sources that count different things. NREL benchmarks the same 8 kW system at $2.95 per watt alone and $4.59 with a fixed 13.5 kWh battery, a difference of about $13,100. California's SGIP records show a median total eligible cost of $16,981 for a residential storage project in 2023 and $15,096 in 2024, on a median battery near 13 kWh. Berkeley Lab's $1.70 per watt paired premium is per watt of PV, so it scales with the array rather than the battery — on California's median 5.7 kW system that is about $9,700. Have the battery quoted as its own line. Most SGIP budgets are closed — see our SGIP guide.
Is there still a solar tax credit in California in 2026?
Not a federal one for a system you buy. Public Law 119-21 ended the 30% federal Residential Clean Energy Credit for expenditures made after December 31, 2025, and the IRS treats the expenditure as made when the original installation is completed. Cash and loan buyers in 2026 get no federal residential credit. State and utility programs are separate and some remain: SGIP can offset storage where budget is open, and California's property-tax exclusion for active solar applies to systems completed before January 1, 2027. Under a lease or PPA the third party owns the system and may still claim a business investment credit — part of why third-party ownership has become relatively more attractive — though whether that value reaches you depends on how the agreement is priced. Be careful with cost pages that still show California prices with 30% subtracted. Confirm your own situation with a tax professional.
How do I check a quote is fair before I sign?
Ask in writing for the cash price of the identical system, with any battery, main-panel upgrade and roof work listed separately. Divide the solar half of that cash price by the system size in DC watts and compare it against Berkeley Lab's cash median of about $3.50 per watt for 2024 US installs; the wider $3.00 to $5.20 spread blends cash and financed systems. Do not use the total on the California disclosure sheet for this: Business and Professions Code § 7169 requires that sheet to state the total cost including financing costs, so on a financed deal it contains interest and will read far above any benchmark — an 8 kW system at $32,000 financed over 25 years shows about $67,800 there. Read it separately, to see what the financing itself costs. The same sheet carries a right to cancel — three business days, or five for a buyer aged 65 or over — but only if the contract was not negotiated at the contractor's own place of business. For anything turning on those rights, confirm with the CSLB or an attorney.
Related reading
Sources & methodology
Figures on this page come from the primary sources below and, where noted, from Cali Energy calculations using the stated assumptions. Rates, incentives, and program terms change; each was verified September 9, 2026.
- Berkeley Lab (LBNL) — U.S. Distributed Solar and Storage, 2025 Data Update (Oct 2025, 2024 installations)
- NREL / U.S. Department of Energy — Solar Photovoltaic System Cost Benchmarks (Q1 2025 headline; Q1 2024 component breakdown)
- CPUC — California Distributed Generation Statistics, cost per watt
- Consumer Financial Protection Bureau — Issue Spotlight: Solar Financing (Aug 2024)
- California Business and Professions Code § 7169 — Solar Energy System Disclosure Document
- CSLB — Solar Energy System Disclosure Document (form 13L-6)
- IRS — Residential Clean Energy Credit
- NREL PVWatts — production estimate used in the estimator
- California SGIP — program metrics
Get an honest solar price for your home
Tell us your roof and your recent bill and we'll give you a real, itemized number — no dealer fees, no door-to-door pressure.
Get a free estimatePrepared by Cali Energy, September 9, 2026. This article is for general educational purposes only and is not legal, tax, financial, engineering, or utility advice. Rates, incentives, codes, permit requirements, equipment specifications, prices, and program terms may change; figures and timelines are estimates, not guarantees. Confirm current requirements with the applicable utility, AHJ, program administrator, manufacturer, or a licensed professional. See our Content Disclaimer. Cali Energy · 19201 Parthenia St, Unit E, Northridge, CA 91324 · CSLB #1032379 (B, C-10, C-39)