

What NEM 3.0 Did to California Solar: The Data
Straight from the state’s interconnection records: home solar connected by PG&E, SCE and SDG&E peaked at 271,000 systems in 2023, the year of the rush to beat NEM 3.0, then fell to 145,000 in 2025 — 46% lower. What was installed changed even more: the share of new systems with a battery rose from 7% in 2022 to 61% in 2025, and leases and PPAs grew from a quarter of the market to 45%. In 2026 installs have leveled off, and in Los Angeles County they are rising again.
Get a free estimate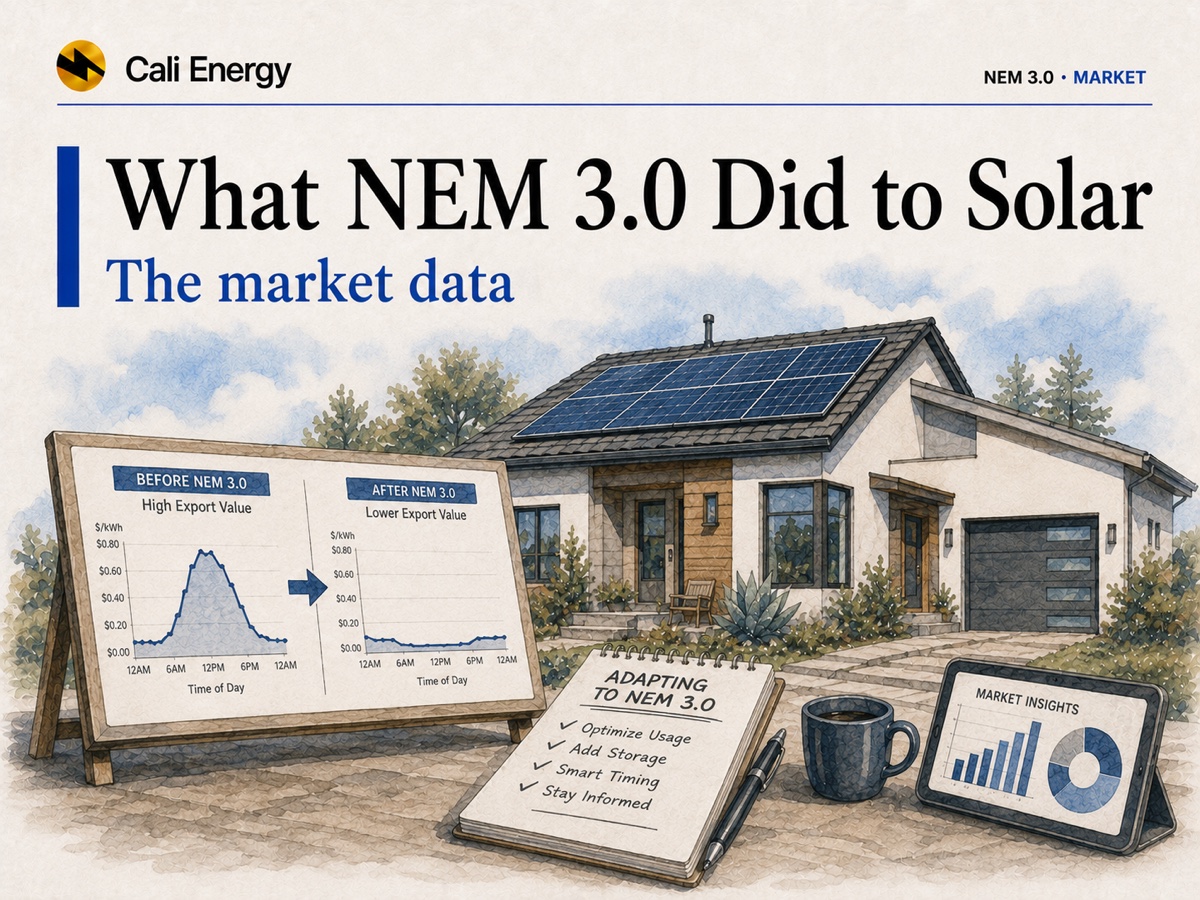
- A rush, then a drop: 243,252 home systems in 2022, 271,223 in 2023, 154,622 in 2024 and 145,370 in 2025.
- Leveling off in 2026: 89,935 in January–August, 4% below the same months of 2025; in Los Angeles County (SCE) 12% above.
- Solar became solar-plus-battery: 61% of new PG&E and SCE systems had a battery in 2025, 66% so far in 2026; in Los Angeles County, 79% and 82%.
- More leases: third-party ownership rose from 25% in 2022 to 45% in 2025.
- More concentration: the largest installer’s share rose from 17% to 26%; the top five from 38% to 43–45%.
What changed, and when
The CPUC adopted the Net Billing Tariff in Decision D.22-12-056 on December 15, 2022 (CPUC). Customers who submitted a complete interconnection application by April 14, 2023 kept NEM 2.0 and had three years to finish; applications from April 15, 2023 went onto the new tariff, which pays for exports by the hour, at values far below retail at midday (NEM 3.0 explained). That deadline produced a rush, and because systems are counted here when the utility approves them, NEM 2.0 systems kept appearing through 2026.
The tariff has been challenged — and upheld
Environmental groups challenged the CPUC’s decision in court. On August 7, 2025 the California Supreme Court ruled unanimously that courts must review the commission’s reading of the law independently rather than defer to it, and sent the case back to the Court of Appeal (Center for Biological Diversity v. Public Utilities Commission, S283614). On March 9, 2026 the Court of Appeal applied that stricter standard and again upheld the decision (A167721, published opinion). The Net Billing Tariff remains in effect for new customers of PG&E, SCE and SDG&E.
The numbers, year by year
| Year | Systems | On NEM 3.0 | With a battery (PG&E, SCE) | Median size, kW DC | Lease / PPA | Largest installer |
|---|---|---|---|---|---|---|
| 2022 | 243,252 | 0% | 7% | 6.5 | 25% | 17% |
| 2023 | 271,223 | 8% | 9% | 6.7 | 24% | 17% |
| 2024 | 154,622 | 65% | 38% | 5.8 | 43% | 22% |
| 2025 | 145,370 | 81% | 61% | 6.2 | 45% | 26% |
| 2026 (Jan–Aug) | 89,935 | 84% | 66% | 6.0 | 44% | 25% |
Source: CPUC California DG Stats, Interconnected Project Sites, data through August 31, 2026; Cali Energy count of residential net-metered solar systems by the year the utility approved them. SDG&E’s file has no storage data, so the battery column covers PG&E and SCE. Installer names were merged across spelling variants. LADWP and other city utilities are not in these records.
How to read it
Volume. 2025 was 46% below the 2023 peak and 40% below 2022. The decline has stopped falling fast: January through August 2026 came in 4% below the same months of 2025.
Batteries. Under NEM 2.0, a midday export earned roughly retail credit, so few buyers added storage — 7% in 2022. Under the new tariff the export is worth a few cents at midday and much more in the evening, so storing it pays: on SCE, a 2026 system earns about 6¢ for a summer-day export and 21¢ for a summer-evening one (SCE). By 2025, 61% of new PG&E and SCE systems had a battery.
Size. The median system shrank from 6.7 kW in 2023 to 5.8 kW in 2024 and has hovered near 6 kW since, as systems were sized closer to what the home uses itself.
Ownership and concentration. Leases and PPAs rose from 25% to 45%, and the market tilted toward the largest companies: the biggest installer, Sunrun, went from 17% of new systems in 2022 to 26% in 2025.
Los Angeles County
SCE territory only; LADWP is not on NEM 3.0.
| Year | Systems | With a battery | Lease / PPA |
|---|---|---|---|
| 2022 | 22,037 | 13% | 25% |
| 2023 | 27,943 | 15% | 23% |
| 2024 | 16,820 | 56% | 40% |
| 2025 | 16,118 | 79% | 47% |
| 2026 (Jan–Aug) | 11,628 | 82% | 46% |
Source: CPUC California DG Stats, SCE file, service county Los Angeles; Cali Energy count.
The county followed the state, with a sharper turn to storage: 82% of new SCE systems in 2026 so far include a battery. Installs in January–August 2026, 11,628, were 12% above the same months of 2025. Homes served by LADWP are outside these numbers and outside NEM 3.0; LADWP still nets exports at retail prices (LADWP net metering).
What it means if you are buying now
Expect a battery in the quote
On SCE most new systems include one. Ask for the price with and without, and see do I need a battery.
Size to your own use
Under the new tariff, surplus exports earn little. Sizing near your yearly use is the norm now.
Compare owning and leasing
Almost half of new systems are leased or on a PPA; compare the totals in cash vs loan vs lease.
Check the installer
A more concentrated market makes the choice of company matter more; see how to choose a solar installer.
Where to go next
Cali Energy is a licensed Los Angeles solar, battery and electrical contractor (CSLB #1032379). We design for the tariff you are actually on — SCE’s Solar Billing Plan or LADWP — and show the numbers with and without a battery. Call +1-323-844-7777 or get a design for your utility.
Frequently asked
Did NEM 3.0 kill rooftop solar in California?
No, but it shrank it. Home systems connected by PG&E, SCE and SDG&E fell from 271,223 in 2023 to 145,370 in 2025, a 46% drop, then leveled off: January–August 2026 was 4% below the same months of 2025.
How much did battery attachment change?
For PG&E and SCE combined, from 7% of new home solar systems in 2022 to 61% in 2025 and 66% in January–August 2026. In Los Angeles County (SCE), from 13% to 79% and 82%.
When did NEM 3.0 go into effect in California?
The CPUC adopted it on December 15, 2022 (D.22-12-056). It applies to interconnection applications submitted on or after April 15, 2023; applications completed by April 14, 2023 kept NEM 2.0 with three years to finish.
Did systems get smaller under NEM 3.0?
Somewhat. The median new system was 6.7 kW DC in 2023, 5.8 in 2024, 6.2 in 2025 and 6.0 in 2026 so far, as buyers sized closer to their own use.
Are more people leasing solar now?
Yes. Leases and PPAs were 25% of new systems in 2022 and 45% in 2025. In Los Angeles County (SCE) the share reached 47% in 2025.
Does NEM 3.0 apply to LADWP customers?
No. LADWP is a city utility with its own net-metering rules, netting exports against purchases at retail prices. These state records cover only PG&E, SCE and SDG&E.
Is NEM 3.0 still being challenged in court?
The main challenge has been decided in the CPUC’s favor so far. The California Supreme Court required stricter court review in August 2025, and on March 9, 2026 the Court of Appeal applied it and upheld the Net Billing Tariff again.
Related reading
Sources & methodology
Figures on this page come from the primary sources below and, where noted, from Cali Energy calculations using the stated assumptions. Rates, incentives, and program terms change; each was verified October 5, 2026.
- CPUC — California DG Stats, Interconnected Project Sites for PG&E, SCE and SDG&E (data through August 31, 2026; Cali Energy counts)
- CPUC — Net Billing Tariff (Decision D.22-12-056)
- SCE — How the Solar Billing Plan works (export values by start year)
- Supreme Court of California — Center for Biological Diversity v. Public Utilities Commission, S283614 (August 7, 2025)
- California Court of Appeal, First District — Center for Biological Diversity v. Public Utilities Commission, A167721 (filed March 9, 2026)
Design for the NEM 3.0 era
Tell us your utility and how you use power, and we’ll show a design with and without a battery, sized to your own use. Estimates, not guarantees.
Get a free estimatePrepared by Cali Energy, October 5, 2026. This article is for general educational purposes only and is not legal, tax, financial, engineering, or utility advice. Rates, incentives, codes, permit requirements, equipment specifications, prices, and program terms may change; figures and timelines are estimates, not guarantees. Confirm current requirements with the applicable utility, AHJ, program administrator, manufacturer, or a licensed professional. See our Content Disclaimer. Cali Energy · 19201 Parthenia St, Unit E, Northridge, CA 91324 · CSLB #1032379 (B, C-10, C-39)