

Where Does LA's Electricity Actually Come From?
Straight from the official labels: in 2025, LADWP’s power mix was 45% renewable, 26% natural gas, 15% nuclear, 3% large hydro and 12% coal and petroleum — the last year of coal from the Intermountain plant in Utah, whose coal units retired in October and November 2025. SCE’s latest published default mix, for 2024, was 35% renewable with 43% unspecified market power. Below: the side-by-side numbers, what changed, why gas still runs the evening, and what it means for rooftop solar.
Get a free estimate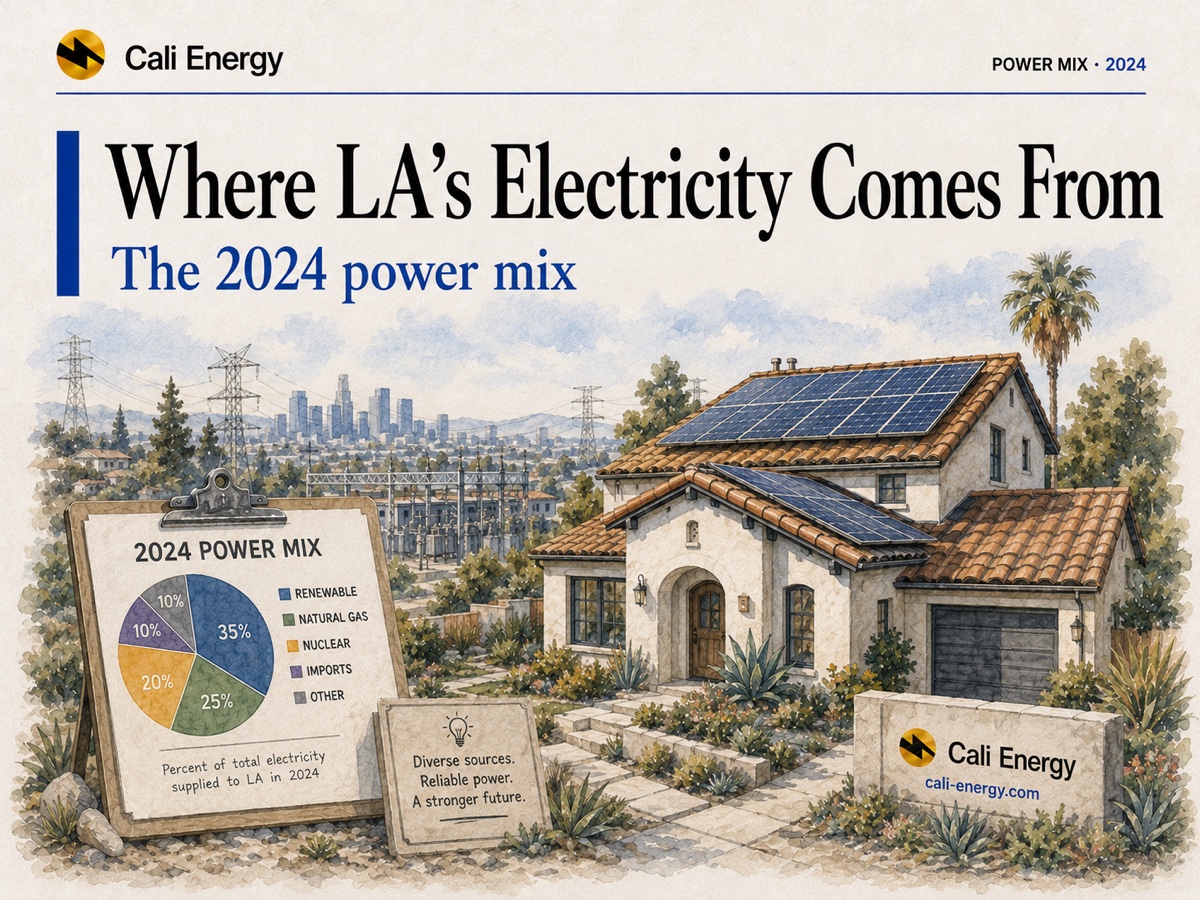
- LADWP 2025: 45% renewable (solar alone 19%), 26% gas, 15% nuclear, 3% large hydro, 12% coal and petroleum; 487 lbs CO2e per MWh.
- Coal is over: the Intermountain Power Project’s coal units in Utah retired in October and November 2025, and LADWP says Los Angeles no longer uses coal-fueled energy from it.
- SCE’s latest label (2024): 35% renewable, 9% nuclear, 8% gas and 43% unspecified market power, most of it fossil; 515 lbs per MWh.
- Gas runs the evening: California leans on gas plants when demand peaks and solar fades, roughly 4 to 7 p.m.
- Targets: LADWP aims for 100% clean, carbon-free energy by 2035; state law requires 100% renewable and zero-carbon retail electricity by 2045.
Where this data comes from
Every electricity supplier in California publishes an annual Power Content Label with the California Energy Commission, listing its mix of sources and its greenhouse-gas intensity; any green marketing claim must match it (CEC). The labels count energy purchased for customers, not the renewable energy credits used for state compliance, so they are the honest measure of what powered a utility’s customers. LADWP posted its 2025 label in September 2026 (LADWP). SCE’s 2025 label was not yet posted on SCE’s or the Energy Commission’s site when we checked on October 5, 2026, so SCE appears with its 2024 figures.
LADWP vs SCE vs the California average
| Source | LADWP 2025 | LADWP 2024 | SCE default 2024 | CA average 2024 |
|---|---|---|---|---|
| Solar | 19% | 15% | 19% | 23% |
| Wind | 14% | 14% | 11% | 14% |
| Geothermal | 9% | 9% | 4% | 5% |
| Eligible hydroelectric | 2% | 2% | 1% | 2% |
| Biomass & biogas | 0% | 0% | 0% | 2% |
| RPS-eligible renewables | 45% | 41% | 35% | 45% |
| Large hydroelectric | 3% | 3% | 5% | 10% |
| Nuclear | 15% | 15% | 9% | 11% |
| Natural gas | 26% | 30% | 8% | 10% |
| Coal & petroleum | 12% | 11% | 0% | 2% |
| Unspecified power (mostly fossil) | 0% | 0% | 43% | 22% |
| GHG intensity, lbs CO2e/MWh | 487 | 505 | 515 | 359 |
Sources: LADWP 2025 Power Content Label · LADWP 2024 · SCE 2024 (default rate). The 2025 label also reports a California utility average on a broader basis that includes losses and other end uses — 384 lbs per MWh against 512 for LADWP on the same basis — so it is not shown in this column.
Read the SCE column with its footnote: 43% of SCE’s 2024 default mix was unspecified power, electricity bought from the open market without a named source. LADWP’s 2025 label says that statewide in 2025, 92% of unspecified power came from fossil fuels (LADWP 2025 label). That is why SCE shows little gas by name and still lands at a similar emissions intensity to LADWP. SCE customers who want a cleaner mix can choose its green rates; its 2024 label lists the 50% Green Rate at 258 lbs per MWh and the 100% Green Rate at zero (SCE 2024). Customers of Clean Power Alliance and other community choice suppliers have their own labels; see which utility serves your city.
What changed at LADWP in 2025
More solar, less gas, and the end of Utah coal.
From 2024 to 2025 LADWP’s solar share rose from 15% to 19% and natural gas fell from 30% to 26%, while emissions intensity dropped from 505 to 487 lbs per MWh. Coal and petroleum still showed 12%, because the Intermountain Power Project in Utah — LADWP’s last coal source, which supplied 11% of Los Angeles’ energy in 2024 — burned coal for most of the year. Its two coal units, 1,800 MW, retired in October and November 2025 (EIA).
LADWP says Los Angeles no longer uses coal-fueled energy from the plant. The new units at the site run on natural gas, with plans to start blending in green hydrogen in 2026, up to 30%; LADWP puts their emissions at about 630 lbs of CO2 per MWh against 2,035 for the old coal units (LADWP). The 2026 label, due in 2027, should be the first without Intermountain coal.
Where the power physically comes from
A system that spans five Western states.
LADWP is the largest municipal power utility in the United States, with 10,896 MW of maximum generating capacity, and in fiscal 2023–24 it supplied more than 20,749 GWh to more than 1.6 million customers, nearly 6,000 of them in the Owens Valley. Its generation, transmission and distribution system spans five Western states (LADWP).
Inside the city
Natural gas plants built in the 1950s–60s and since modernized: Haynes, Scattergood and Valley, plus quick-start peaking turbines at Harbor and Valley (LADWP).
Hydro
The Castaic pumped-storage plant, with seven units, and the Owens River Gorge hydroelectric project; from the 1930s, power from Hoover Dam over a 266-mile line (LADWP).
Utah
The Intermountain Power Project, LADWP’s last coal source until its coal units retired in late 2025; the new units there burn natural gas, with hydrogen to be blended in (LADWP).
Wind, solar, geothermal, nuclear
Together 57% of the 2025 mix — 19% solar, 14% wind, 9% geothermal, 15% nuclear — mostly from plants outside the city.
The gas share lives in the evening
Annual percentages hide timing. In California, natural gas plants balance the daily swing between demand and solar output; demand and gas generation are often highest in the late afternoon and early evening, between about 4 and 7 p.m., after solar has peaked (EIA). Midday power is the cleanest of the day, and the evening is the most fossil-heavy — the same hours that cost the most on time-of-use rates.
2035 for LADWP, 2045 for California
State law, SB 100, requires renewable and zero-carbon resources to supply 100% of electric retail sales by 2045 (CEC). LADWP’s own goal is 100% clean, carbon-free energy by 2035 (LADWP). Both are targets; each year’s label shows the progress.
What this means for an LA homeowner
Your address picks your mix
LADWP, SCE, a city utility or a community choice supplier each publish their own label; check which one serves you.
Evening power is the dirty part
Solar covers the clean middle of the day. Using that energy in the evening takes a battery; see do I need a battery.
The dirty hours are the pricey hours
The 4–9 p.m. peak on time-of-use rates overlaps the gas-heavy evening; see electricity rates in Los Angeles.
Panels pay back their carbon
Manufacturing emissions and payback are in solar’s carbon footprint.
Where to go next
Cali Energy is a licensed Los Angeles solar, battery and electrical contractor (CSLB #1032379). We can show how much of your own use a rooftop system and battery would cover, hour by hour. Call +1-323-844-7777 or ask for an estimate.
Frequently asked
What percentage of LADWP's electricity is renewable?
45% in 2025 by the state’s renewables definition — 19% solar, 14% wind, 9% geothermal and 2% small hydro — up from 41% in 2024. Counting large hydro and nuclear, 62% came from renewable and zero-carbon sources (LADWP 2025 Power Content Label).
Does Los Angeles still get electricity from coal?
Not from 2026 on, according to LADWP. Coal and petroleum were 12% of its 2025 mix, almost all from the Intermountain Power Project in Utah, whose coal units retired in October and November 2025. The new units there run on natural gas, with green hydrogen to be blended in.
Is SCE's electricity cleaner than LADWP's?
On their latest labels they are close: LADWP 487 lbs CO2e per MWh in 2025, SCE’s default rate 515 in 2024. SCE reports little gas by name but 43% unspecified market power, which is mostly fossil. SCE’s green rates are much lower.
What is a Power Content Label?
An annual disclosure, filed with the California Energy Commission, of the sources and greenhouse-gas intensity of the electricity a supplier sold its customers. It counts energy, not the renewable energy credits used for state compliance, and marketing claims must match it.
What are California's SB 100 clean-energy targets?
SB 100 requires renewable and zero-carbon resources to supply 100% of retail electricity sales by 2045. LADWP has set an earlier goal of 100% clean, carbon-free energy by 2035.
Is rooftop solar cleaner than LA grid power?
Its output carries no operating emissions, and its manufacturing footprint is paid back over time. The grid is cleanest at midday, when solar produces, and most fossil-heavy in the evening, so pairing panels with a battery shifts clean power into the hours that matter most.
Related reading
Sources & methodology
Figures on this page come from the primary sources below and, where noted, from Cali Energy calculations using the stated assumptions. Rates, incentives, and program terms change; each was verified October 5, 2026.
- LADWP — 2025 Power Content Label (published September 2026)
- LADWP — Power Content Label page
- CEC — 2024 Power Content Label, LADWP
- CEC — 2024 Power Content Label, Southern California Edison
- CEC — Power Source Disclosure: Power Content Labels
- LADWP — Intermountain Power Project (end of coal, IPP Renewed, 2035 goal)
- EIA — U.S. coal capacity retired in 2025 (Intermountain units 1 and 2, October–November 2025)
- EIA — In California, natural gas helps balance electricity demand and solar output
- CEC — SB 100 Joint Agency Report (100% by 2045)
- LADWP — Power System (capacity, energy supplied, customers, five Western states)
- LADWP — Power Past & Present (Hoover, Owens River Gorge, Haynes, Scattergood, Valley, Harbor, Castaic)
See what your roof can do about your power mix
Tell us your utility and a recent bill and we’ll show how much of your own use solar and a battery could cover. Estimates, not guarantees.
Get a free estimatePrepared by Cali Energy, October 5, 2026. This article is for general educational purposes only and is not legal, tax, financial, engineering, or utility advice. Rates, incentives, codes, permit requirements, equipment specifications, prices, and program terms may change; figures and timelines are estimates, not guarantees. Confirm current requirements with the applicable utility, AHJ, program administrator, manufacturer, or a licensed professional. See our Content Disclaimer. Cali Energy · 19201 Parthenia St, Unit E, Northridge, CA 91324 · CSLB #1032379 (B, C-10, C-39)