

How Many Solar Panels to Charge an EV?
For most Los Angeles drivers, four to six extra 400 W panels. Most trims of the best-selling EVs in LA County use 24–36 kilowatt-hours per 100 miles on the EPA test, the average car is driven about 10,800 miles a year, and each kilowatt of panels in LA makes about 1,700 kWh. A large electric SUV or pickup at 40–50 kWh per 100 miles needs seven or eight. Your own car’s rating and your odometer give the real number.
Get a free estimate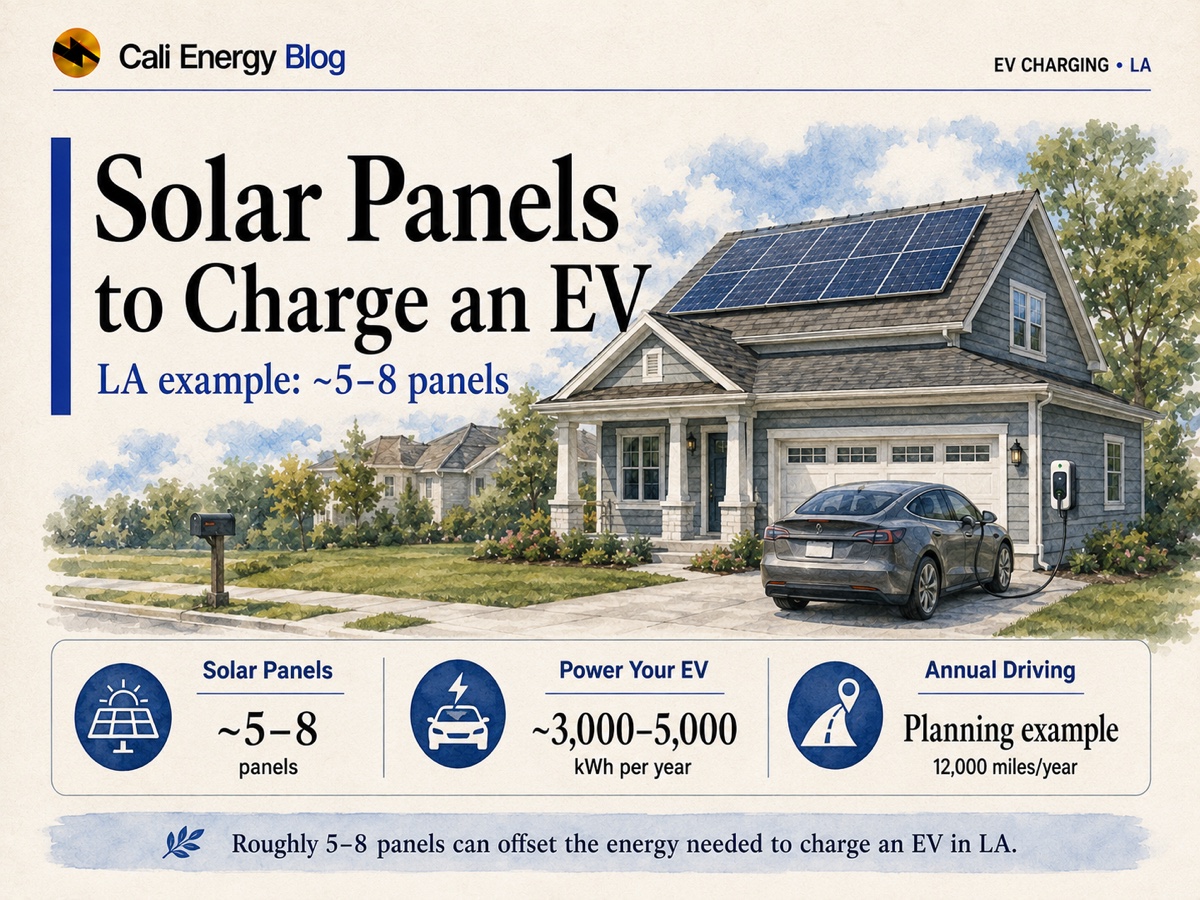
- The formula: yearly miles × EPA kWh per 100 miles ÷ 100 = yearly charging energy; divide by about 1,700 kWh per kW in LA, then by 0.4 for 400 W panels.
- Use the EPA number as is: it is measured at the wall and already includes Level 2 charging losses.
- Seasons swing it: covering a 30-mile day takes about 3.3 panels in June but 5.9 in December; sizing to the year lets the bill even that out.
- Already have solar on SCE’s NEM 1.0 or 2.0? Growing the system by more than the greater of 10% or 1 kW can cost you the legacy tariff.
Panels for the EVs Los Angeles actually drives
The California Energy Commission counts new EV registrations by county. In 2025, 96,891 new battery-electric cars were registered in Los Angeles County, and the ten best-selling models made up 65% of them. Here are the top sellers, with their EPA ratings across 2025–2026 trims from fueleconomy.gov and the solar to cover them at the national average of 10,787 miles a year:
| Model | LA County sales, 2025 | EPA kWh/100 mi | kWh a year | 400 W panels |
|---|---|---|---|---|
| Tesla Model Y | 25,433 | 24.3–32.4 | 2,620–3,490 | 4–6 |
| Tesla Model 3 | 13,896 | 24.3–30.9 | 2,620–3,330 | 4–5 |
| Hyundai Ioniq 5 | 5,120 | 29.0–35.8 | 3,130–3,860 | 5–6 |
| Honda Prologue | 4,071 | 32.5–35.3 | 3,510–3,810 | 6 |
| Ford Mustang Mach-E | 3,140 | 30.7–40.2 | 3,310–4,340 | 5–7 |
| Chevrolet Equinox EV | 2,854 | 31.1–35.2 | 3,350–3,800 | 5–6 |
| BMW i4 | 2,569 | 28.5–42.2 | 3,070–4,550 | 5–7 |
| Rivian R1S | 1,975 | 39.5–50.1 | 4,260–5,400 | 7–8 |
Sources: CEC New ZEV Sales (data as of June 30, 2026) · EPA fueleconomy.gov combined kWh/100 mi, lowest to highest trim · FHWA VM-1, 2024 · NREL PVWatts, 1,700 kWh per kW in Los Angeles. Panels rounded up. Cali Energy arithmetic.
Two things move the answer most. Trim matters: big wheels and dual or quad motors push a Model Y from 24 to 32 and a BMW i4 from 28 to 42. And mileage matters one for one: 15,000 miles instead of 10,800 adds about 40% to every row.
Work it out for your car
1. Find your car’s combined kWh per 100 miles on fueleconomy.gov. 2. Multiply by your yearly miles and divide by 100. 3. Divide by 1,700 for kilowatts of panels in Los Angeles; check your own roof in PVWatts. 4. Divide by 0.4 for 400 W panels.
Example: 12,000 miles × 30 kWh/100 mi = 3,600 kWh a year ÷ 1,700 = 2.1 kW = six 400 W panels. Don’t add 10–15% for charging losses: the EPA measures EV energy at the wall outlet, with Level 2 charger and on-board charger losses included.
December vs June
The average car covers about 30 miles a day. At 26 kWh per 100 miles, a typical Model Y figure, that is 7.7 kWh a day. One 400 W panel on an LA roof makes:
| Month | kWh per panel per day | Panels for 7.7 kWh |
|---|---|---|
| December | 1.30 | 5.9 |
| March | 1.84 | 4.2 |
| June | 2.30 | 3.3 |
| Year average | 1.86 | 4.1 |
Source: NREL PVWatts v8, Northridge, 20° south, 14% losses. Cali Energy arithmetic.
Sized to the year, the panels overproduce for the car in summer and fall short in winter; how the utility credits that difference is the next question. See LA sun hours by month.
Charging straight from the panels
Between 11 a.m. and 2 p.m. an LA array delivers about 0.5 kW per kilowatt of panels in December and 0.7 in July. So the 2 kW or so you add for a car makes about 1–1.4 kW at midday — roughly what a 120-volt outlet draws at 12 amps (1.4 kW). A Level 2 charger at 32 amps pulls 7.7 kW, so even a whole-house array covers only part of it at any moment, and commuters’ cars are usually away at midday anyway. Real-time solar charging is a bonus; the yearly match is what makes solar “pay for” the car. See Level 2 charger cost in LA.
What SCE and LADWP customers should know
SCE: charge at midday or late
On the Solar Billing Plan, midday solar exported to the grid earns little, so charging at home at midday uses it best. Otherwise charge after 9 p.m., past the 4–9 p.m. peak.
LADWP: timing matters less
Exports net against imports at retail under NEM. LADWP also offers $1,000 toward a home charger and a discount on a separately metered EV (details).
Adding to existing solar
On SCE NEM 1.0 or 2.0, a system can grow by the greater of 10% or 1 kW of its original rating (NEM-ST); a bigger addition can move it to the Solar Billing Plan. See adding panels to an existing system.
Battery charging
A 30-mile day is 7.7 kWh, more than half a 13.5 kWh home battery. Charging the car from the battery overnight leaves less for the house; charging from the grid after the evening peak is the usual alternative.
For per-mile charging costs on each LA rate, see EV charging at home in California.
Where to go next
Cali Energy sizes solar for Los Angeles homes with the car included, from your bills and your odometer. Call +1-323-844-7777 or ask for a solar-plus-EV estimate — production figures are estimates, not guarantees. For the whole house, see can solar power a whole house?
Frequently asked
How many solar panels does it take to charge an electric car?
In Los Angeles, four to six 400 W panels for most popular EVs at about 10,800 miles a year, and seven or eight for a large electric SUV or pickup. Multiply your miles by your car’s EPA kWh per 100 miles, divide by 100, then by 1,700 and by 0.4.
How many solar panels to charge a Tesla Model Y or Model 3?
About four to six 400 W panels in Los Angeles at average mileage: their EPA ratings run 24–32 kWh per 100 miles depending on trim, or roughly 2,600–3,500 kWh a year.
How much does an EV increase my electricity use?
About 2,600–3,900 kWh a year for the best-selling EVs at average mileage, and up to about 5,400 for the least efficient trims of large SUVs. An average California home uses about 6,040 kWh a year, so the car can add half again.
Do I need to add extra for charging losses?
No. The EPA measures EV energy use at the wall outlet, so Level 2 charging losses are already in the kWh per 100 miles figure.
Can I charge my EV directly from solar during the day?
Partly. A 2 kW addition makes about 1–1.4 kW at midday, close to a 120-volt outlet’s draw; a Level 2 charger at 7.7 kW takes most of its power from the rest of the array or the grid. On SCE, midday charging at home is still the best use of surplus solar.
Will adding panels for my EV affect my NEM 2.0 status?
On SCE it can. A legacy NEM system may grow by the greater of 10% or 1 kW of its original rating; growing it further can move it to the Solar Billing Plan. Check before you add panels.
Should I charge my EV from a home battery?
Usually not. A 30-mile day takes about 7.7 kWh, more than half a 13.5 kWh battery, so the house has less left for the evening. Off-peak grid charging is the usual plan.
Related reading
Sources & methodology
Figures on this page come from the primary sources below and, where noted, from Cali Energy calculations using the stated assumptions. Rates, incentives, and program terms change; each was verified October 5, 2026.
- California Energy Commission — New ZEV Sales by county and model (data as of June 30, 2026)
- U.S. EPA / DOE — fueleconomy.gov vehicle data (combined kWh per 100 miles)
- U.S. EPA — Fuel Economy and EV Range Testing (energy measured at the wall, charging losses included)
- FHWA — Highway Statistics 2024, Table VM-1 (miles per light-duty vehicle)
- NREL — PVWatts v8 (Los Angeles production per kW, hourly)
- SCE — Schedule NEM-ST: modifications to legacy systems
- SCE — Time-of-Use residential rate plans
- LADWP — Service Rider NEM, Net Energy Metering
- LADWP — Electric Vehicles: charger rebate and EV rate discount
Charge your car on your own sunshine
Get solar sized for your EV, your driving and your LA roof, with charging and storage options. Estimates, not guarantees.
Get a free estimatePrepared by Cali Energy, October 5, 2026. This article is for general educational purposes only and is not legal, tax, financial, engineering, or utility advice. Rates, incentives, codes, permit requirements, equipment specifications, prices, and program terms may change; figures and timelines are estimates, not guarantees. Confirm current requirements with the applicable utility, AHJ, program administrator, manufacturer, or a licensed professional. See our Content Disclaimer. Cali Energy · 19201 Parthenia St, Unit E, Northridge, CA 91324 · CSLB #1032379 (B, C-10, C-39)