

How Much Electricity Does Air Conditioning Use?
Air conditioning is the single biggest reason a Southern California electric bill jumps in summer. This guide explains how tons, BTU and watts relate, what real certified equipment draws, how much electricity California homes actually use for cooling in a year, and what an hour of AC costs on SCE and LADWP rates — with a calculator you can adjust to your own system.
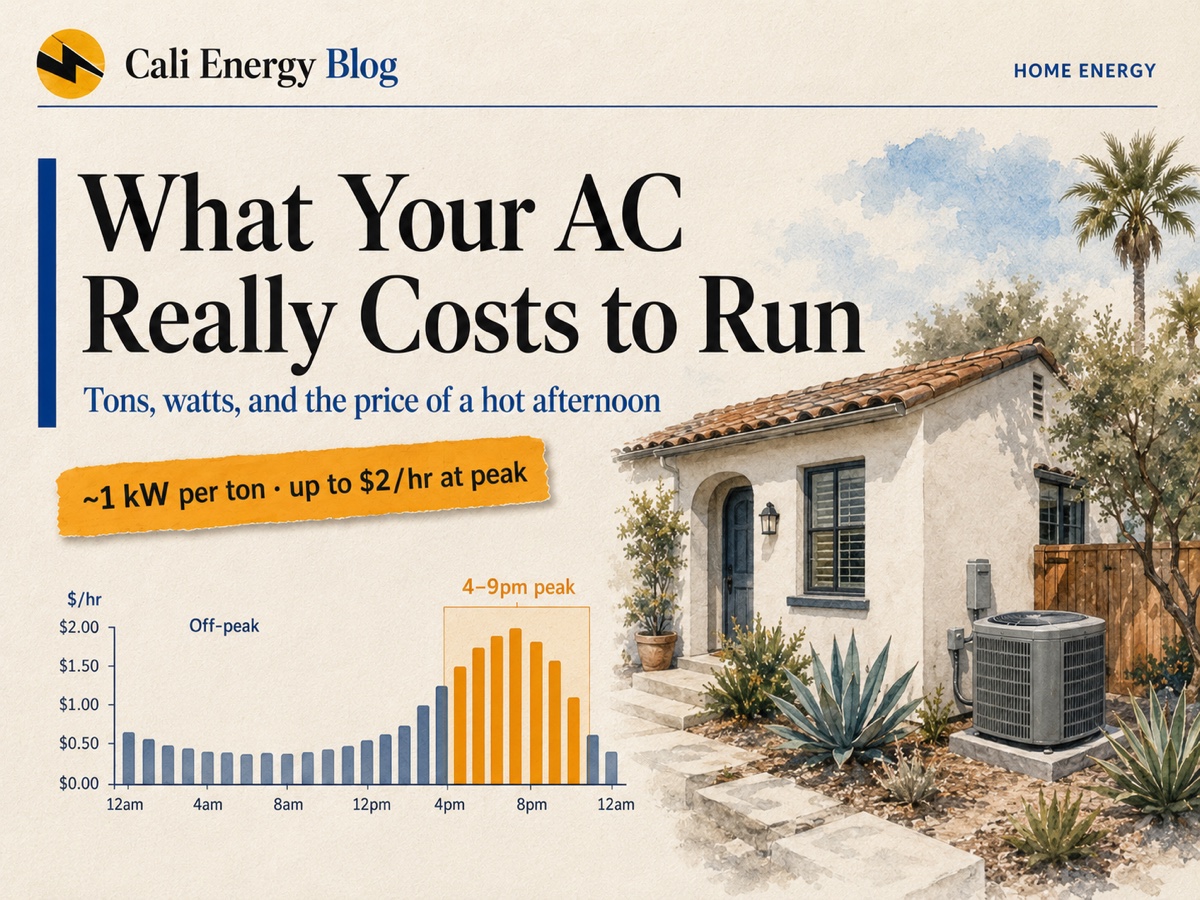
- Cooling capacity is measured in tons (1 ton = 12,000 BTU/h). Across ENERGY STAR’s certified 3-ton split systems, the median full-load draw at 95 °F is about 3,000 W — roughly 1,000 W per ton, with the top tenth near 1,200 W per ton.
- A higher SEER2 does not guarantee lower peak watts. SEER2 is a seasonal average; the draw on a hot afternoon follows EER2.
- In the CEC’s 2019 appliance survey, homes with central AC used about 1,344 kWh a year for it in SCE territory and 1,021 kWh in LADWP’s — and more than twice as much in the hottest SCE zone as in the mildest.
- On SCE’s TOU-D-4-9PM plan, a summer weekday hour from 4 to 9 p.m. costs 59¢/kWh, about 1.8 times the 33¢ off-peak rate.
- This article is for estimating operating cost only. It must not be used to select equipment size or replace a professional load calculation.
Tons, BTU, and watts
Air-conditioner capacity is measured in tons — a legacy unit from the days of cooling with ice. One ton equals 12,000 BTU/h of cooling. Typical homes use 2-ton (24,000 BTU/h), 3-ton (36,000), 4-ton (48,000) or 5-ton (60,000) systems.
Electrical draw is a different question. The most defensible estimate of full-load power is watts ≈ BTU/h ÷ EER2, where EER2 is the efficiency rating at a 95 °F outdoor test point. To see what real equipment does, we took ENERGY STAR’s list of certified air-source heat pumps — in cooling mode a heat pump is an air conditioner — and divided each ducted split system’s rated capacity by its EER2:
| Size (rated capacity) | Certified combinations | Median EER2 | Median draw | Middle 80% |
|---|---|---|---|---|
| 2 ton (22,000–24,500 BTU/h) | 34,395 | 12.5 | 1,883 W | 1,793–2,229 W |
| 3 ton (33,000–36,500 BTU/h) | 23,247 | 11.5 | 3,026 W | 2,855–3,612 W |
| 4 ton (44,000–48,500 BTU/h) | 16,736 | 11.0 | 4,217 W | 3,913–4,800 W |
| 5 ton (54,000–60,500 BTU/h) | 6,989 | 11.0 | 5,045 W | 4,658–6,278 W |
Cali Energy calculation from ENERGY STAR Certified Air-Source Heat Pumps (data set updated October 5, 2026; each row is a certified outdoor/indoor combination, not a separate product). ENERGY STAR units are more efficient than the federal minimum, so older or basic equipment can draw more.
That is where the familiar rule of thumb of about 1,000–1,200 watts per ton comes from: the 3-ton median works out to about 1,010 W per ton and the 90th percentile to about 1,200. Actual draw still moves with outdoor and indoor temperature, the blower, duct static pressure and how the compressor modulates, so treat any single number as an approximation.
Why a high SEER2 can still mean high peak watts: variable-speed systems earn their seasonal rating at part load. Among the certified 3-ton combinations, those rated 16–18 SEER2 have a median EER2 of 10.0, below the 11.7 median of units rated 14–16 SEER2. Federal rules allow it: in the Southwest, a split AC rated 15.2 SEER2 or higher only has to meet 9.8 EER2. If peak-hour draw matters to you — for an expensive 4–9 p.m. rate or a battery — compare EER2, not just SEER2.
AC operating-cost estimator
Cali Energy calculation · design-condition estimate · illustrative, not a quote
Watts are estimated as BTU/h ÷ EER2 at design conditions — a peak-load approximation. Real-world average draw is lower because the compressor cycles and modulates. For an exact figure, use the equipment documentation, a permanently installed energy monitor, or a measurement by a qualified HVAC/electrical professional. Rates are illustrative 2026 examples shown before any baseline credit; your actual rate and plan may differ. EER2 presets come from ENERGY STAR’s certified 3-ton split systems (10th percentile, median, 90th percentile).
SEER vs SEER2 — and the 2023 standard
SEER (Seasonal Energy Efficiency Ratio) measures seasonal cooling output per unit of energy — higher is more efficient. On January 1, 2023, SEER2 replaced it, using a more realistic test (higher external static pressure). SEER and SEER2 are based on different test procedures and should not be treated as directly interchangeable — use the manufacturer’s certified SEER2 and EER2 ratings.
California is in the U.S. Department of Energy’s Southwest region (with AZ, NV and NM), which adds a peak-efficiency (EER2) floor for central air conditioners installed on or after January 1, 2023:
| Equipment | Minimum SEER2 | Minimum EER2 / HSPF2 |
|---|---|---|
| Split AC under 45,000 BTU/h | 14.3 | 11.7 EER2 (9.8 if rated 15.2 SEER2 or higher) |
| Split AC 45,000 BTU/h and up | 13.8 | 11.2 EER2 (9.8 if rated 15.2 SEER2 or higher) |
| Split heat pump (national) | 14.3 | 7.5 HSPF2 |
A central AC below these minimums cannot be installed in the Southwest region.
Source: 10 CFR 430.32, energy conservation standards · verified October 6, 2026.
What California homes actually use for cooling in a year
Watts tell you the rate of use; the bill depends on hours. The best measured answer for California comes from the California Energy Commission’s 2019 Residential Appliance Saturation Study (RASS), which combined surveys, utility billing data and weather to estimate yearly use by appliance. The figures are weather-normalized averages for homes that have each type of cooling:
| Cooling type | SCE: kWh/yr | SCE: share of homes | LADWP: kWh/yr | LADWP: share of homes |
|---|---|---|---|---|
| Central air conditioning | 1,344 | 68% | 1,021 | 52% |
| Room (window/wall) AC | 665 | 18% | 529 | 29% |
| Evaporative cooler | 1,109 | 12% | 587 | 9% |
Source: CEC 2019 RASS, Volume 2: Results, Table 14 (electric UECs by utility). Survey period October 2018–September 2019.
Two cautions. These are averages across mild and hot neighborhoods, and the rows compare households, not machines — evaporative coolers, for instance, are used mostly in hot, dry inland areas, which pushes their average up. Even so, the measured numbers are a useful check on estimates that assume eight full-load hours every day: 1,344 kWh at SCE’s average residential rate of 34.5¢/kWh (from October 1, 2026, per its rate advisory) is about $460 a year. A hot inland home with a large system can use several times the average.
What share of the bill is cooling? The same survey puts the average SCE household’s total use at 6,424 kWh a year and LADWP’s at 5,112 kWh, so central AC works out to roughly one-fifth of a year’s electricity — a rough comparison, because those totals average all homes, not only the ones with central AC. Since cooling is concentrated in a few hot months, its share of a summer bill is much larger than its share of the year.
What it costs to run — worked examples
The math is simple: kWh = watts ÷ 1,000 × hours of compressor run time, then cost = kWh × rate. The table assumes the median certified EER2 of 11.5 and shows how much the rate period changes the result. Rates are 2026 examples, before any baseline credit.
| System & run time | Daily kWh | LADWP Tier 1, Jul–Sep 2026 (26.4¢) | SCE summer off-peak (33¢) | SCE summer 4–9pm peak (59¢) |
|---|---|---|---|---|
| 3 ton × 6 hrs | 18.8 | $4.96 | $6.20 | $11.08 |
| 3 ton × 10 hrs | 31.3 | $8.27 | $10.33 | $18.47 |
| 4 ton × 8 hrs | 33.4 | $8.82 | $11.02 | $19.70 |
The takeaway: five hours of a 3-ton AC in SCE’s 4–9 p.m. weekday peak costs about $4 more than the same hours off-peak — roughly $90 over a month’s 22 weekdays. These are illustrative Cali Energy calculations from the stated assumptions, not measured bills.
The plan matters too. SCE’s TOU-D-5-8PM charges about 72¢/kWh in its narrower summer peak, and from October through May the 4–9 p.m. window on TOU-D-4-9PM drops to a 50¢ mid-peak. LADWP’s standard tiered rate has no time-of-day charge, but its Tier 3 price applies only in the June–September high season (41.0¢ in July–September 2026, versus 33.2¢ in October–December). For plan choice, see SCE time-of-use plans compared and LADWP rates explained.
Rate sources (before baseline credit): SCE Time-of-Use plans · LADWP residential rates · verified October 6, 2026.
Where you live changes everything
California’s building climate zones capture how much cooling a home needs. The Los Angeles area spans several of them:
| CEC climate zone | Reference city | Setting |
|---|---|---|
| CZ 6 | Torrance | Coastal |
| CZ 8 | Fullerton | Inland coastal plain |
| CZ 9 | Burbank–Glendale | Inland valleys |
| CZ 10 | Riverside | Inland Empire |
| CZ 14 | Palmdale | High desert |
| CZ 15 | Palm Springs | Low desert |
Source: CEC building climate zones.
The appliance survey shows how much that matters. It reports central-AC use by the CEC’s forecasting climate zones (a different map from the building zones above), alongside each zone’s cooling degree days, a measure of how hot the year runs:
| Forecasting zone | Central AC, kWh/yr per home | Cooling degree days |
|---|---|---|
| SCE zone 8 | 914 | 827 |
| SCE zone 7 | 979 | 1,132 |
| SCE zone 10 (desert) | 1,519 | 1,953 |
| SCE zone 9 | 1,807 | 2,020 |
| SCE zone 11 (desert) | 2,296 | 2,321 |
| LADWP zone 16 | 887 | 1,039 |
| LADWP zone 17 | 1,183 | 1,562 |
Source: CEC 2019 RASS, Project Overview, Table 5 (weather-normalized). The report identifies zones 10 and 11 as desert zones.
Within SCE alone, a home in the hottest zone used about 2.5 times the central-AC electricity of one in the mildest.
Heat pump vs traditional AC
A heat pump is essentially an air conditioner that can also run in reverse to heat. Its cooling efficiency uses the same SEER2 and EER2 metrics, so for cooling a heat pump and a straight AC with the same ratings use about the same electricity. The heat pump’s advantage is on the heating side: the median certified 3-ton split heat pump in the ENERGY STAR list is rated 8.5 HSPF2, which works out to about 2.5 units of heat per unit of electricity over a heating season, against 1.0 for electric-resistance heat. California’s 2025 Energy Code, which applies to buildings whose permit applications are submitted on or after January 1, 2026, expands the use of heat pumps in new homes.
Sources: ENERGY STAR certified heat pumps (HSPF2 ÷ 3.412 = seasonal heat per unit of electricity) · CEC 2025 Building Energy Efficiency Standards · verified October 6, 2026.
Rebates and credits for efficient cooling (2026)
As of October 6, 2026, in Cali Energy’s review of the official program pages:
- LADWP Consumer Rebate Program — heat pumps: higher rebates apply to qualifying heat-pump HVAC purchased and installed on or after November 1, 2025. The amount is set per ton by SEER2 and HSPF2: ducted central, split and packaged systems range from $1,000 per ton (above 15.2 SEER2 / 7.7 HSPF2) to $1,250 per ton (above 19.6 SEER2 / 8.9 HSPF2); ductless and mini-split systems reach the advertised $2,500 per ton only above 20.5 SEER2 / 9.1 HSPF2. Applications must be postmarked within 12 months of purchase.
- LADWP — central AC: $100 per ton at 15.2 SEER2 and $120 per ton at 16.0 SEER2.
- LADWP — smart thermostats: up to $100 through its Efficient Product Marketplace for purchases June 1–October 31, 2026 (apply by December 31), and up to $145 a year in incentives through the Power Savers program, which lets LADWP raise the thermostat by up to 4 degrees during demand-response events.
- SCE: a $75 bill credit for letting SCE adjust an eligible smart thermostat by up to four degrees during demand-response events, and the Energy Savings Assistance program, which can replace a central AC or heat pump at no cost for income-qualified households where the service is available.
- TECH Clean California: single-family heat-pump HVAC incentives have been fully reserved statewide since November 14, 2025. Separately, TECH says incentives for San Fernando Valley communities affected by the Aliso Canyon gas storage facility — including Porter Ranch, Granada Hills, Northridge, Chatsworth, Canoga Park, Reseda, West Hills and Van Nuys — are to open beginning in late summer 2026; check the program page for current status.
- Federal tax credit: the 30% (up to $600) credit for central air conditioners covered products purchased and installed from January 1, 2023 through December 31, 2025.
Every rebate amount is subject to eligibility, approved equipment, funding availability, installation date, and program rules, and is not guaranteed until approved by the program administrator. Do not treat a rebate as part of a system’s final cost before it is approved — funding is often first-come, first-served and can run out.
Sources: LADWP Consumer Rebate Program · LADWP Efficient Product Marketplace · LADWP Power Savers · SCE rebates · SCE Energy Savings Assistance · TECH single-family incentives · TECH San Fernando Valley · ENERGY STAR tax credit · verified October 6, 2026.
Using solar and a battery to offset AC
AC demand peaks on hot, sunny afternoons — roughly when solar production peaks — so solar naturally offsets a lot of daytime cooling. The expensive hours are SCE’s 4–9 p.m. peak, after solar output falls, which is where a battery helps: charged midday, a properly sized battery system may support some or all AC operation during peak hours, avoiding 59–72¢/kWh summer peak electricity.
Whether a given battery can actually carry an AC depends on the compressor’s starting (locked-rotor) current, the inverter’s continuous power output, battery capacity, a soft-starter, and other simultaneous loads — a small battery may not even start a large single-stage compressor. On LADWP’s flat retail net metering the arbitrage case is weaker (every solar kWh already offsets full retail); under SCE’s Net Billing Tariff, shifting AC load to a battery is where the savings are. See our guides on battery sizing and whole-home vs critical-loads backup.
A note on comfort and safety: do not reduce cooling in a way that jeopardizes health or required indoor conditions. The cost examples here are informational, not personal safety guidance.
Frequently asked
How many watts does a 3-ton AC use?
How much does it cost to run AC per hour in California?
What share of my electric bill is air conditioning?
What is SEER2 and how is it different from SEER?
Can I size my AC by square footage?
Can a home battery run my air conditioning?
Are there rebates for a high-efficiency AC or heat pump in 2026?
Related reading
Sources & methodology
Figures on this page come from the primary sources below and, where noted, from Cali Energy calculations using the stated assumptions. Rates, incentives, and program terms change; each was verified October 6, 2026.
- ENERGY STAR — Certified Air-Source Heat Pumps data set (EER2, SEER2, HSPF2, capacity)
- eCFR — 10 CFR 430.32 energy conservation standards (Southwest SEER2/EER2)
- CEC — 2019 RASS, Volume 2: Results (electric UECs by utility)
- CEC — 2019 RASS, Project Overview (central AC UEC and cooling degree days by zone)
- SCE — Time-of-Use residential rate plans
- SCE — Rate advisory (average residential rate from October 1, 2026)
- LADWP — Residential electric rates (R-1A)
- LADWP — Consumer Rebate Program
- LADWP — Efficient Product Marketplace
- LADWP — Power Savers demand response
- SCE — Rebates & Marketplace
- SCE — Energy Savings Assistance program
- TECH Clean California — single-family incentives
- TECH Clean California — San Fernando Valley incentives
- ENERGY STAR — Central air conditioner tax credit (2023–2025)
- CEC — 2025 Building Energy Efficiency Standards
- CEC — Building Climate Zones
About this guide
This reference is maintained by the Cali Energy research team to help California homeowners understand and estimate air-conditioning electricity use. Calculations are illustrative and depend on the stated assumptions. Confirm equipment specifications with the manufacturer and any sizing decision with a qualified HVAC professional.
Prepared by Cali Energy, October 6, 2026. This article is for general educational purposes only and is not legal, tax, financial, engineering, or utility advice. Rates, incentives, codes, permit requirements, equipment specifications, prices, and program terms may change; figures and timelines are estimates, not guarantees. Confirm current requirements with the applicable utility, AHJ, program administrator, manufacturer, or a licensed professional. See our Content Disclaimer. Cali Energy · 19201 Parthenia St, Unit E, Northridge, CA 91324 · CSLB #1032379 (B, C-10, C-39)