

Average Home Electricity Use in California
A typical California home used about 503 kWh a month in 2024 — roughly 16.5 kWh a day, second-lowest of any state and about 42% below the U.S. average. This guide breaks the number down by utility, month, type of home and appliance, explains why California uses so much less, and includes a tool to see where your own usage lands.
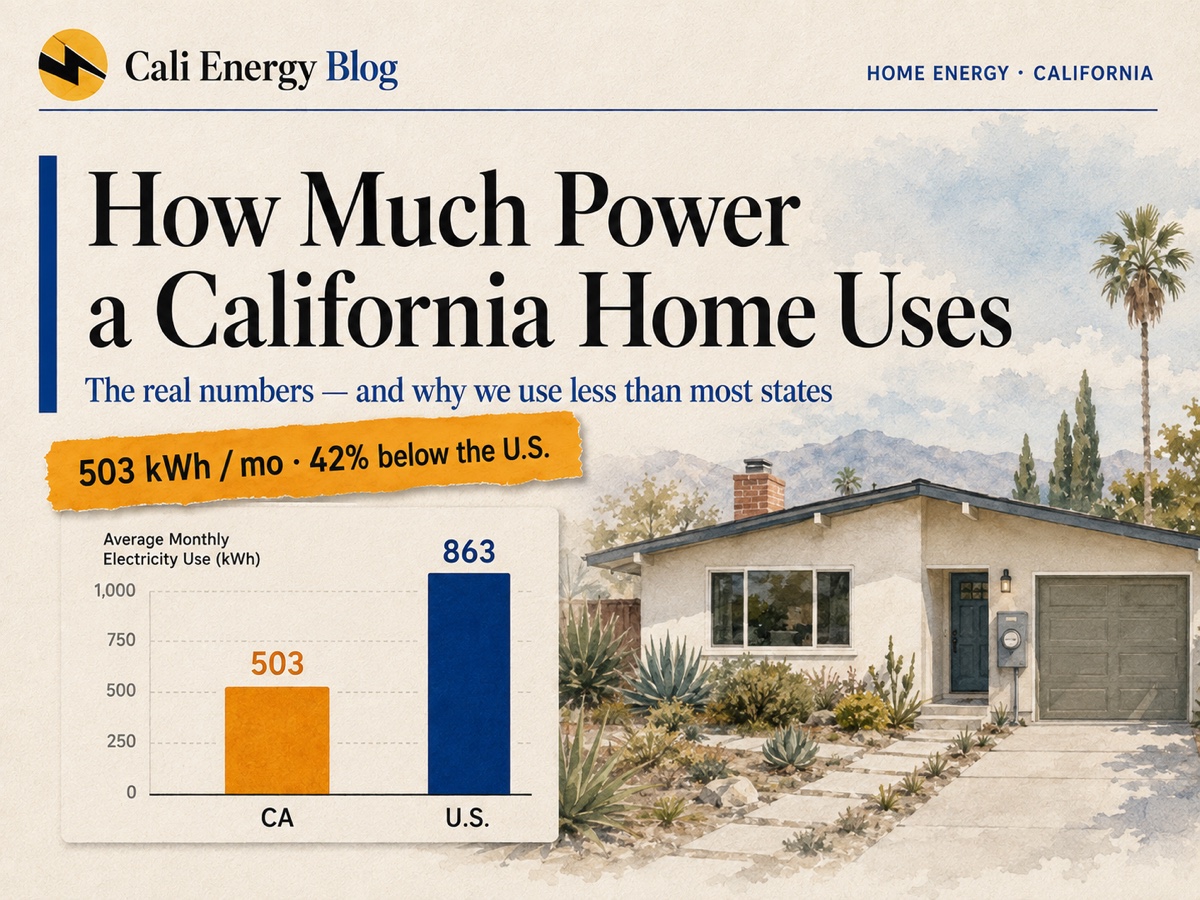
- The average California home used 503 kWh a month in 2024 — about 16.5 kWh a day or 6,040 kWh a year (EIA). That is 42% below the U.S. average of 863 kWh and the second-lowest of the 50 states and D.C.; only Hawaii used less.
- The average bill was still higher than the U.S. average, because California’s price per kWh was the second-highest in the country.
- Use swings with the seasons: in 2024 the monthly average per home ran from 364 kWh in May to 696 kWh in August.
- Home type matters more than almost anything: in the CEC’s appliance survey, a single-family home used about twice as much as an apartment in a larger building.
- “Average” is not a target — a home above it isn’t necessarily inefficient.
California vs the U.S. — same-year figures
Both rows below come from the same EIA table (2024 Average Monthly Bill – Residential), so the comparison is like-for-like:
| Geography | Customers | kWh/month | kWh/day | Price ¢/kWh | Monthly bill |
|---|---|---|---|---|---|
| California | 14.2M | 503 | 16.5 | 31.97¢ | $160.86 |
| U.S. Total | 143.1M | 863 | 28.4 | 16.48¢ | $142.26 |
| Difference | — | ~42% less | ~42% less | ~94% higher | ~13% higher |
So a California household uses far less electricity than the typical American home but pays a slightly higher bill. Per year, that is about 6,040 kWh in California against about 10,360 kWh nationally. Among the 50 states and D.C., only Hawaii used less per home (495 kWh a month) — and only Hawaii paid more per kWh.
Prices have kept rising since: EIA’s preliminary July 2026 figure for California homes is 33.61¢/kWh, about 84% above the U.S. average of 18.31¢. For what that means for bills, see the average electric bill in California.
Sources: EIA 2024 Average Monthly Bill, Residential (Table 5A) · EIA Electric Power Monthly, Table 5.6.A (data for July 2026, released September 24, 2026) · verified October 6, 2026. Per-day and per-year figures are Cali Energy conversions of the monthly averages.
Check your own usage
Enter your average use (from a bill or your utility’s online account), per month or per day, and pick your utility to see how it compares with that utility’s residential average and the U.S. average.
Is my electricity use high for California?
Compares your number with EIA 2024 residential averages for your utility, the state and the U.S.
This is a Cali Energy editorial classification — not a government standard, a code threshold, or a determination of whether your home is efficient. Climate, household size, medical equipment, EVs, a pool, electrification, and behind-the-meter solar all move the number a lot. Your entry is processed locally in your browser and is not uploaded or stored by Cali Energy.
Average use by utility
EIA’s annual utility survey (Form EIA-861) gives residential sales and customer counts for every utility. Dividing one by the other gives the average use per home in each service area for 2024:
| Utility | Residential customers | kWh/month | kWh/day |
|---|---|---|---|
| PG&E (incl. CCA customers) | 5,047,461 | 429 | 14.1 |
| SCE (incl. CCA customers) | 4,594,415 | 497 | 16.3 |
| LADWP | 1,410,191 | 485 | 15.9 |
| SDG&E (incl. CCA customers) | 1,364,361 | 294 | 9.7 |
| SMUD (Sacramento) | 592,557 | 702 | 23.1 |
| Imperial Irrigation District | 142,078 | 1,159 | 38.1 |
| Anaheim Public Utilities | 105,839 | 467 | 15.4 |
| Riverside Public Utilities | 100,450 | 637 | 20.9 |
| Glendale Water & Power | 77,563 | 411 | 13.5 |
| Pasadena Water and Power | 58,551 | 476 | 15.6 |
| Burbank Water and Power | 46,157 | 467 | 15.4 |
Source: EIA-861 annual electric power industry report, 2024 final data, file Sales_Ult_Cust_2024. For PG&E, SCE and SDG&E, homes that buy power from a community choice program are included, because the utility still delivers it. The statewide total computed the same way is 503 kWh, matching EIA Table 5A.
Climate drives much of the spread: SDG&E’s largely coastal territory averages under 300 kWh a month, while the Imperial Irrigation District in the desert averages more than 1,100. Around Los Angeles, SCE and LADWP sit close to the state average. EIA’s early-release 2025 data put LADWP at 469 kWh a month; EIA advises against adding those preliminary figures into state totals. To find out which utility serves an address, see LA-area electric utilities by city.
Month by month
The annual average hides a strong summer peak. EIA’s monthly survey (Form EIA-861M) shows average use per California home in each month of 2024:
| Month | kWh per home | kWh/day | Average price |
|---|---|---|---|
| Jan | 525 | 16.9 | 29.6¢ |
| Feb | 451 | 15.6 | 31.4¢ |
| Mar | 418 | 13.5 | 32.5¢ |
| Apr | 381 | 12.7 | 34.5¢ |
| May | 364 | 11.7 | 34.5¢ |
| Jun | 477 | 15.9 | 33.2¢ |
| Jul | 691 | 22.3 | 32.7¢ |
| Aug | 696 | 22.5 | 31.2¢ |
| Sep | 615 | 20.5 | 31.8¢ |
| Oct | 503 | 16.2 | 32.5¢ |
| Nov | 422 | 14.1 | 30.2¢ |
| Dec | 489 | 15.8 | 30.6¢ |
Source: EIA-861M monthly electric power industry report, file sales_revenue.xlsx (2024 final). Monthly sales follow utility billing cycles, so they lag the weather by a few weeks.
The twelve months add up to about 6,030 kWh, consistent with the annual average. The lowest months are spring, when neither heating nor cooling runs much; the highest are July and August. EIA’s preliminary figures show a lower average of about 480 kWh a month for 2025, with a lower summer peak (572 kWh in July 2025 against 691 a year earlier), and about 487 kWh for the twelve months through July 2026.
How usage varies across California
The California Energy Commission’s 2019 Residential Appliance Saturation Study (RASS) combined a survey of homes with their billing data and weather. Its averages show how much the type of home and the climate zone matter:
| Type of home | kWh/year | kWh/month |
|---|---|---|
| Single-family home | 7,553 | 629 |
| Townhome | 4,691 | 391 |
| Apartment, 2–4 units | 4,139 | 345 |
| Apartment, 5+ units | 3,670 | 306 |
| Mobile home | 5,798 | 483 |
Source: CEC 2019 RASS, Volume 2: Results, Table 11 (utilities in the study: PG&E, SCE, SDG&E, SMUD and LADWP). Survey period October 2018–September 2019, weather-normalized.
| Forecasting zone | kWh/year | kWh/month |
|---|---|---|
| SCE zone 7 | 5,669 | 472 |
| SCE zone 8 | 5,740 | 478 |
| SCE zone 9 | 7,828 | 652 |
| SCE zone 10 (desert) | 7,177 | 598 |
| SCE zone 11 (desert) | 8,882 | 740 |
| LADWP zone 16 | 4,768 | 397 |
| LADWP zone 17 | 5,840 | 487 |
Source: CEC 2019 RASS, Volume 2: Results, Tables 16–17; the Project Overview identifies zones 10 and 11 as desert. These are the CEC’s forecasting zones, not the building climate zones used in the Energy Code.
A single-family home averages about 630 kWh a month, an apartment in a building of five or more units about 310, and within SCE’s territory the highest-use zone averages more than 1.5 times the lowest. Much of that climate gap is cooling; for how much air conditioning adds, see how much electricity AC uses.
Where the electricity goes
The same study estimated yearly use for each appliance in homes that have it, and how many homes have it. Multiplying the two gives each appliance’s share of an average home’s use:
| End use | SCE home | LADWP home |
|---|---|---|
| Everything else not estimated separately (incl. lighting and plug loads) | 1,804 | 1,582 |
| Refrigerators and freezers | 1,607 | 1,375 |
| Cooling (central AC, room AC, evaporative coolers, attic fans) | 1,170 | 739 |
| TVs, computers, home office | 556 | 487 |
| Pool and spa | 382 | 229 |
| Cooking (range/oven, microwave) | 268 | 238 |
| Laundry and dishwashing | 233 | 170 |
| Space heating and furnace fans | 180 | 129 |
| Outdoor lighting | 140 | 101 |
| Water heating | 58 | 77 |
| Electric-vehicle charging (2018–19) | 69 | 43 |
| Well pumps | 28 | 18 |
| Total | 6,495 | 5,188 |
Source: CEC 2019 RASS, Volume 2: Results, Table 14 (unit energy consumption × saturation). The study’s own household totals are 6,424 (SCE) and 5,112 kWh (LADWP); the small difference comes from rebuilding the totals from the published, rounded table values.
Refrigeration and the many small loads in a home outweigh cooling on a yearly basis, even in SCE territory. Space and water heating barely register because most California homes heat with gas: in the survey, about 13% of SCE homes and 14% of LADWP homes had electric-resistance heat, and 4% and 6% a heat pump. Those shares, and EV charging, have grown since 2019 — an electrified home with an EV can use far more than any average in this article.
Why California uses so much less
Several factors combine, and researchers disagree about how much each one matters:
- Mild climate. Most Californians live in coastal and southern zones with modest heating and cooling needs, and most homes heat with gas rather than electricity.
- Household size and housing. California households have stayed larger than the national average while households elsewhere shrank, and more people live in apartments and smaller homes.
- Building and appliance standards. California’s building energy code (Title 24, Part 6) is updated every three years, and the state sets its own appliance efficiency standards (Title 20).
- Rooftop solar. California homes had about 13,900 MW of small-scale solar at the end of 2025, which EIA estimates generated about 23.6 TWh that year — equal to roughly 29% of residential grid sales (81.9 TWh). Power used on site never shows up as “sales,” so the grid-measured averages in this article understate how much electricity solar homes actually consume.
- High prices. At nearly twice the national rate, every kWh costs Californians more, which gives households a strong reason to conserve.
Economist Arik Levinson (Georgetown University) found that nearly 90% of the gap in per-person residential electricity use between California and other states in 2009 could be explained by household characteristics that California’s regulations do not target, such as climate, income and household size — about 40% by household size alone. It is one analysis of one year’s data, and it measures per-person use; others credit the state’s efficiency standards with a larger role.
Sources: Levinson, “California energy efficiency: Lessons for the rest of the world, or not?” (Journal of Economic Behavior & Organization, 2014) · EIA-861M small-scale solar estimates · CEC Building Energy Efficiency Standards · CEC Title 20 appliance standards · verified October 6, 2026.
New homes and solar
California’s 2025 Energy Code generally requires solar PV for certain newly constructed single-family buildings, subject to defined exceptions (for example, insufficient solar access or roof area). Whether it applies to a specific project is confirmed through the applicable code process and the local building authority — it is not an automatic requirement for every new home.
Frequently asked
What is the average home electricity use in California?
How many kWh per day does a California home use?
How much electricity does a California home use per year?
Why does California use less electricity than other states?
Is my electricity usage high?
How much does a California home spend on electricity per month?
Do new California homes have to have solar?
Related reading
Sources & methodology
Figures on this page come from the primary sources below and, where noted, from Cali Energy calculations using the stated assumptions. Rates, incentives, and program terms change; each was verified October 6, 2026.
- EIA — 2024 Average Monthly Bill, Residential (Table 5A)
- EIA — Form EIA-861 annual data (2024 utility sales and customers)
- EIA — Form EIA-861M monthly data (sales, customers, small-scale solar)
- EIA — Electric Power Monthly, Table 5.6.A (July 2026 prices)
- CEC — 2019 RASS, Volume 2: Results
- CEC — 2019 RASS, Project Overview
- Levinson (2014) — California energy efficiency: Lessons for the rest of the world, or not?
- CEC — Building Energy Efficiency Standards (Title 24)
- CEC — Appliance Efficiency Regulations (Title 20)
- CEC — 2025 Single-Family Solar PV (Energy Code)
About this guide
This reference is maintained by the Cali Energy research team using EIA and CEC data to explain California household electricity use. Figures carry their data year; the usage classification is an editorial guide, not an official standard.
Prepared by Cali Energy, October 6, 2026. This article is for general educational purposes only and is not legal, tax, financial, engineering, or utility advice. Rates, incentives, codes, permit requirements, equipment specifications, prices, and program terms may change; figures and timelines are estimates, not guarantees. Confirm current requirements with the applicable utility, AHJ, program administrator, manufacturer, or a licensed professional. See our Content Disclaimer. Cali Energy · 19201 Parthenia St, Unit E, Northridge, CA 91324 · CSLB #1032379 (B, C-10, C-39)