

Rate Escalation in 25-Year Solar Savings: Picking a Number You Can Defend
The first year of a solar proposal is calculated from today's rates; every year after that rests on one assumption — how fast utility rates rise. That single number moves the 25-year savings more than almost anything else: each dollar of first-year bill savings becomes about $25 over 25 years if rates never rise, $38 at 3.4% a year and $48 at 5%. Cali-Graf, the free design and proposal app built by Cali Energy, a Los Angeles solar and roofing contractor, starts at 3.4%, lets the seller set anything from 0 to 15%, and prints the assumption under the proposal's savings sheet. For context, 3.4% is close to general inflation over the past decade and about half of what California's average residential electricity price actually did from 2016 to 2025 — while the last two years were slower. Pick a number you can explain, say it out loud, and show what a lower one does.
How much the assumption matters
Because the increase compounds, the 25-year total is very sensitive to it. Ignoring panel degradation, one dollar of first-year bill savings adds up over 25 years to:
| Assumed rate increase | 25-year multiple of first-year savings |
|---|---|
| 0% a year | 25.0× |
| 2% | 32.0× |
| 3.4% | 38.4× |
| 5% | 47.7× |
| 7% | 63.2× |
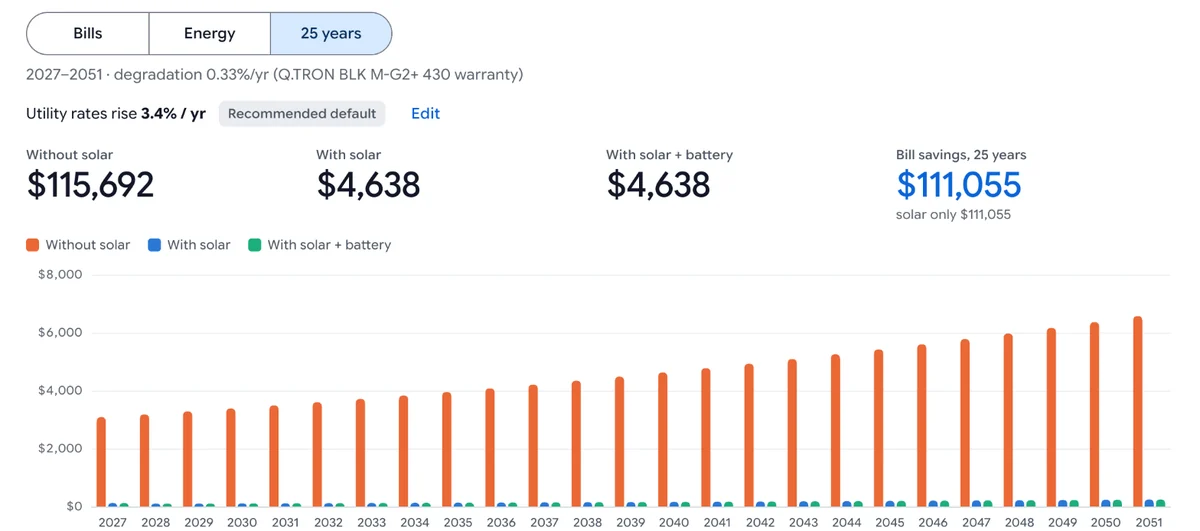
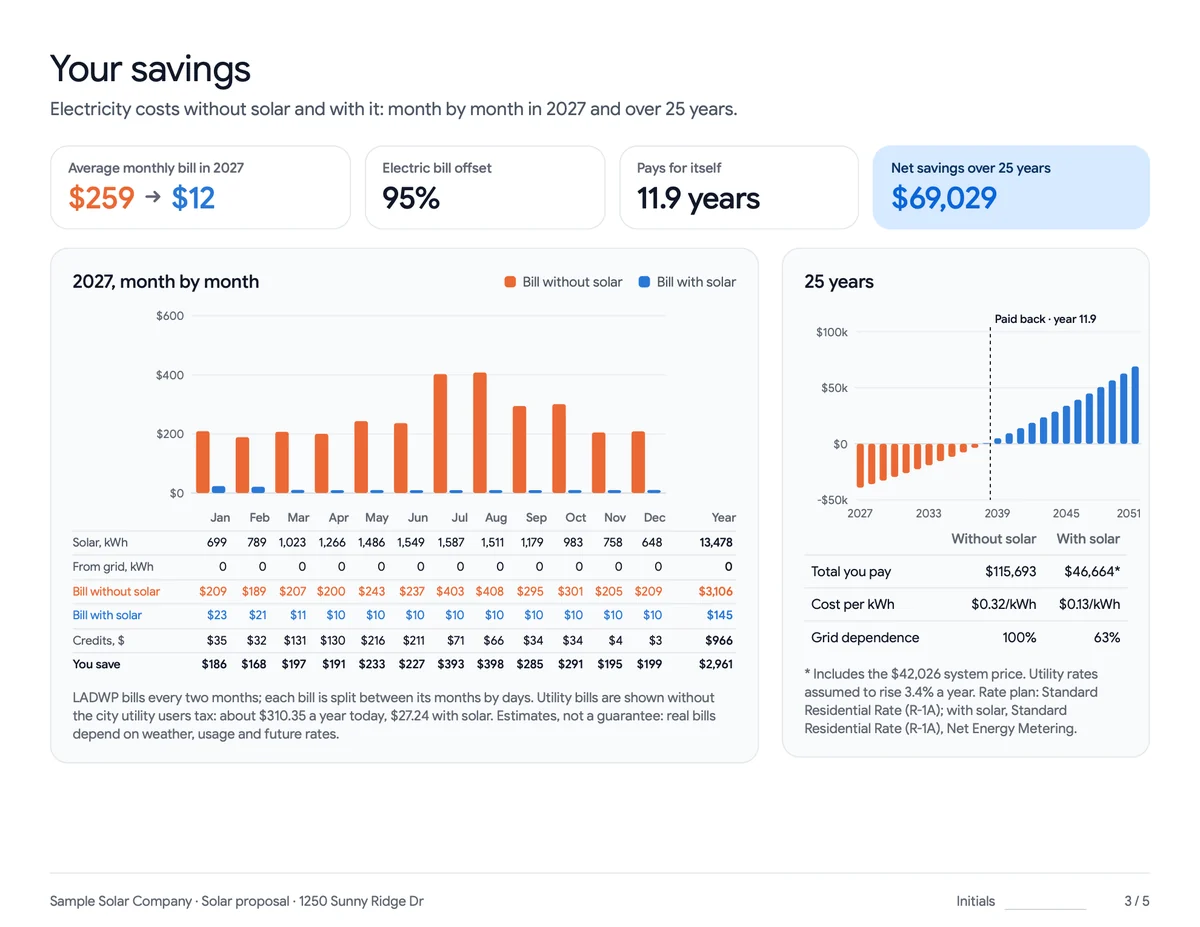
So moving from 3.4% to 5% raises the 25-year bill savings by about a quarter — with nothing about the system changing. On Cali-Graf's public sample proposal for a made-up LADWP home, first-year savings of $2,961 become about $111,000 of 25-year bill savings at 3.4% — the difference between Total you pay without solar ($115,693) and with solar, before the system price. The first year itself doesn't depend on the assumption at all.
What rates have actually done
| Period | What happened | As a yearly rate |
|---|---|---|
| California average residential price, 2016–2025 | 17.39¢ → 32.54¢ per kWh, +87% | about 7% a year |
| SCE, 2016–2024 (bundled customers) | 15.84¢ → 32.43¢, +105% | about 9% a year |
| LADWP, 2016–2025 | 15.26¢ → 26.48¢, +74% | about 6% a year |
| Consumer prices (CPI), 2016–2025 | +34% | about 3.3% a year |
| California average, 2025 and early 2026 | +2%, then about 2.5% | — |
The yearly rates are our arithmetic on figures from EIA and the Bureau of Labor Statistics; the details are in California electricity rate history, and the utility-specific stories in why SCE rates are high and LADWP rates explained.
Read together, the table supports a modest assumption rather than a dramatic one. The past decade's 7–9% a year included one-time jumps — wildfire costs, grid investment — and the most recent years have been closer to inflation. A seller who assumes the last decade will simply repeat itself is promising the customer a lot.
Choosing your number
- 3.4% — Cali-Graf's starting value: close to general inflation, well below the last decade's electricity increases. Easy to defend as conservative.
- Lower (0–2%) — useful as a stress test: "even if rates barely rise, the system still pays back in …".
- Higher (5%+) — only with a reason you'd write down, and never as the only scenario.
Whatever you pick, keep it the same across the options you give one customer, and across competing quotes when you compare them — a proposal with a higher assumption isn't a better system. In Cali-Graf the number is set per calculation under Price & settings → Utility rate increase, % per year, or as your default under Settings → New calculations start with; on the result's 25 years tab, Edit next to Utility rates rise changes it in place.
Run a customer at 3.4% and at 1% side by side — the stress test takes one copy.
The other half of the forecast: panel degradation
Panels make a little less each year, and the forecast takes that from the panel's datasheet — Degradation after year 1 in the panel's details — or 0.5% a year when the datasheet doesn't give it. There's nothing to set; it pulls the 25-year number slightly the other way.
Two 25-year numbers — know which one you're quoting
| Number | Where | What it counts |
|---|---|---|
| Bill savings, 25 years | The result's 25 years tab | Bills without solar minus bills with solar — the system price isn't in it |
| 25-year savings (net) | The price tile, and the proposal cover as Net savings over 25 years | Bill savings minus the system price, or minus all loan payments |
Customers remember the bigger number; the proposal leads with the net one. Saying which is which avoids a dispute later.
Re-running an old proposal after rates change
Utilities change prices several times a year, and Cali-Graf updates its rate tables. A result belongs to the rates it was calculated with, so when they change, an existing calculation shows Rates updated — recalculate, and the PDF won't build from an out-of-date result. Before you re-send a proposal from last month, open it, press Calculate, check what moved, and make a new PDF. Changing only the price, the payment, the customer's name or your business card doesn't need a recalculation.
Frequently asked
What rate increase should I use for solar savings?
What rate increase do solar companies assume?
How much have California electricity rates gone up?
Does the rate increase affect the first-year savings?
What happens to an old proposal when utility rates change?
Related reading
Sources & methodology
Product facts on this page come from Cali-Graf's own help center and the pages linked below; figures in examples come from the stated inputs. Features, limits and supported utilities change; each was verified October 16, 2026.
- Cali-Graf Help — Rate growth and panel degradation
- Cali-Graf Help — Savings over 25 years
- Cali-Graf Help — Why the calculator asks you to recalculate
- Cali-Graf Help — Set defaults for new calculations
- Cali-Graf — Sample proposal (made-up demo home)
- U.S. Energy Information Administration — Electricity data (EIA-861, Electric Power Monthly)
- U.S. Bureau of Labor Statistics — Consumer Price Index
Show the rate assumption on the proposal
Cali-Graf prints the assumed rate increase and rate plans under the 25-year savings, lets you set your own default, and makes a stress-test copy in one click. Free, with daily fair-use limits. Historical figures here come from EIA and BLS data; future rates are a forecast, not a fact.
Prepared by Cali Energy, October 16, 2026. This article is for general educational purposes only and is not legal, tax, financial, engineering, or utility advice. Rates, incentives, codes, permit requirements, equipment specifications, prices, and program terms may change; figures and timelines are estimates, not guarantees. Confirm current requirements with the applicable utility, AHJ, program administrator, manufacturer, or a licensed professional. See our Content Disclaimer. Cali Energy · 19201 Parthenia St, Unit E, Northridge, CA 91324 · CSLB #1032379 (B, C-10, C-39)