

California Electricity Rates: A Decade of Data
Straight from the EIA: California’s average residential electricity price was 33.25¢ per kWh in January–July 2026, and 33.61¢ in July alone — about 1.8 times the U.S. average of 18.19¢ and second only to Hawaii among the 50 states and DC. From 2016 to 2025 the state’s average rose from 17.39¢ to 32.54¢, +87%, while consumer prices rose 34% and the U.S. electricity average 38%. The climb slowed after 2024: +2% in 2025 and about +2.5% so far in 2026.
Get a free estimate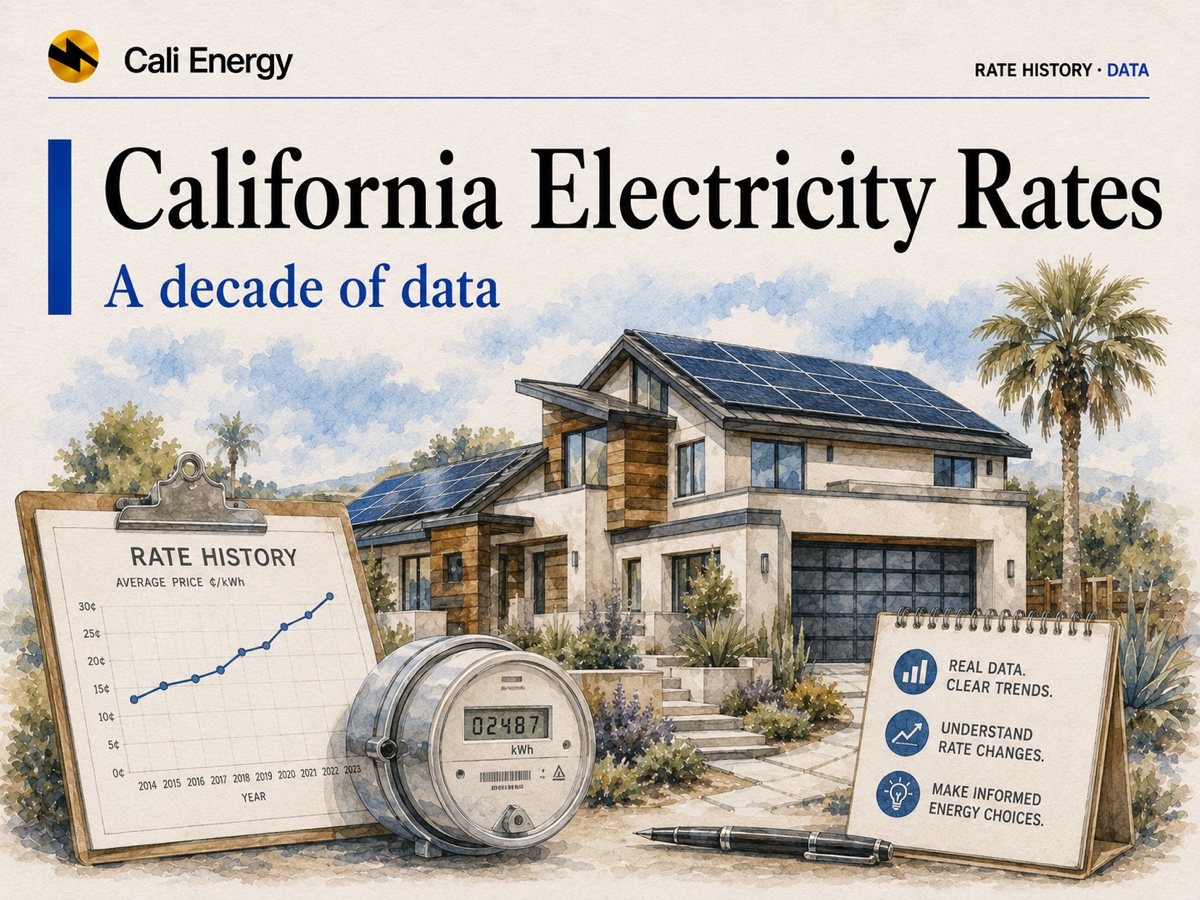
- 2026 so far: 33.25¢ per kWh on average for homes in January–July, up from 32.45¢ a year earlier; the U.S. average is 18.19¢.
- Ten years: 17.39¢ in 2016, 32.54¢ in 2025 — up 87%, against 34% for consumer prices and 38% for U.S. electricity.
- The steep part was 2021–2024: +12%, +15%, +13% and +8% a year.
- By utility, 2024: SDG&E 43.63¢, PG&E 39.62¢, SCE 32.43¢, LADWP 23.84¢ — the three investor-owned utilities roughly doubled since 2016, LADWP rose 56%.
- SCE in 2026: an average residential rate of 34.5¢ from October 1, by SCE’s own figure.
- For solar: every kilowatt-hour you make and use yourself saves the price you would have paid, so higher rates raise the value of self-use.
California’s average residential electricity price, year by year
| Year | California | U.S. | California vs U.S. | California change |
|---|---|---|---|---|
| 2016 | 17.39¢ | 12.55¢ | 1.39× | — |
| 2017 | 18.31¢ | 12.89¢ | 1.42× | +5% |
| 2018 | 18.84¢ | 12.87¢ | 1.46× | +3% |
| 2019 | 19.15¢ | 13.01¢ | 1.47× | +2% |
| 2020 | 20.45¢ | 13.15¢ | 1.56× | +7% |
| 2021 | 22.82¢ | 13.66¢ | 1.67× | +12% |
| 2022 | 26.17¢ | 15.12¢ | 1.73× | +15% |
| 2023 | 29.51¢ | 16.00¢ | 1.84× | +13% |
| 2024 | 31.97¢ | 16.48¢ | 1.94× | +8% |
| 2025 | 32.54¢ | 17.30¢ | 1.88× | +2% |
| 2026 (Jan–Jul) | 33.25¢ | 18.19¢ | 1.83× | — |
Sources: EIA annual average prices by state (2016–2020) · Electric Power Monthly, February 2023 (2021–2022) · Electric Power Annual, Table 2.10 (2023–2024) · Electric Power Monthly, February 2026 (2025, preliminary) · Table 5.6.B (2026 year to date through July). Nominal cents.
By utility: SCE, PG&E, SDG&E, LADWP and the city utilities
The statewide average hides a twofold spread.
| Year | SCE | PG&E | SDG&E | LADWP | Burbank | Glendale | Pasadena |
|---|---|---|---|---|---|---|---|
| 2016 | 15.84¢ | 19.94¢ | 20.72¢ | 15.26¢ | 16.16¢ | 19.45¢ | 17.53¢ |
| 2018 | 16.30¢ | 22.22¢ | 25.31¢ | 18.31¢ | 16.57¢ | 19.83¢ | 19.31¢ |
| 2020 | 18.22¢ | 23.65¢ | 25.51¢ | 20.63¢ | 15.83¢ | 21.08¢ | 20.96¢ |
| 2021 | 21.33¢ | 25.86¢ | 30.65¢ | 21.19¢ | 15.90¢ | 21.73¢ | 21.03¢ |
| 2022 | 24.62¢ | 30.98¢ | 37.92¢ | 22.24¢ | 16.01¢ | 23.32¢ | 21.16¢ |
| 2023 | 32.33¢ | 34.04¢ | 45.48¢ | 22.99¢ | 17.12¢ | 25.08¢ | 24.14¢ |
| 2024 | 32.43¢ | 39.62¢ | 43.63¢ | 23.84¢ | 19.25¢ | 33.81¢ | 25.98¢ |
| 2025 (prelim.) | — | — | — | 26.48¢ | 21.50¢ | 35.51¢ | — |
| 2016→2024 | +105% | +99% | +111% | +56% | +19% | +74% | +48% |
Source: EIA Form EIA-861 annual utility data, Sales to Ultimate Customers, 2016–2024 final and 2025 early release (August 2026); Cali Energy calculation. For SCE, PG&E and SDG&E the figure covers customers who buy both power and delivery from the utility; customers of community choice suppliers pay a different mix. The 2025 early release does not include the three large utilities.
From 2016 to 2024 the average residential price roughly doubled at all three investor-owned utilities: SCE from 15.84¢ to 32.43¢ (+105%), PG&E from 19.94¢ to 39.62¢ (+99%) and SDG&E from 20.72¢ to 43.63¢ (+111%). The city utilities rose less: LADWP from 15.26¢ to 23.84¢ (+56%), reaching 26.48¢ in 2025, and Burbank by 19%; Glendale’s climbed 74%, most of it in 2024. SCE’s own figure for 2026: an average residential rate of 34.4¢ per kWh, rising to 34.5¢ (33.3¢ after the California Climate Credit) on October 1, 2026, with the average residential bill going from $185.85 to $188.64 a month (SCE rate advisory). Details: why SCE rates are so high, LADWP rates explained.
The monthly figure swings
EIA also publishes a monthly average, which moves with the season and the mix of customers: California’s residential figure was 35.25¢ in April 2026 and 33.61¢ in July (EIA, June 2026 issue; Table 5.6.A). The year-to-date average, 33.25¢, is the steadier number to compare.
Faster than inflation
The consumer price index rose 34% from 2016 to 2025, from an annual average of 240.0 to 321.9 (BLS). California’s residential electricity price rose 87% — more than 2.5 times as fast. In 2016 dollars, the 2025 price is about 24.3¢, a real increase of roughly 40%. The U.S. average rose 38%, close to inflation, so the gap widened: California paid 1.39 times the national average in 2016 and 1.88 times in 2025 (Cali Energy calculation from EIA and BLS figures).
The pace has slowed. California’s average rose 2% in 2025 and about 2.5% in the first seven months of 2026, while the U.S. average rose 5% and about 7% (EIA). The reasons for the earlier surge — wildfire costs, grid spending and more — are covered in why SCE rates are so high and the California rate changes tracker.
Why it is not your rate
EIA’s figure is revenue divided by kilowatt-hours sold, across every utility in the state, so it blends the investor-owned utilities with city utilities such as LADWP, and it includes fixed monthly charges. The all-sector average, which also counts businesses and industry, was 27.79¢ in January–July 2026 — the source of the lower numbers sometimes quoted (EIA). For the prices on your own bill, see electricity rates in Los Angeles or LADWP rates explained.
What it means for solar
Self-use is worth the retail price
Solar the house uses directly avoids buying that kilowatt-hour, so the value rises with the rate.
Exports are a different price
On SCE’s Solar Billing Plan, exports earn hourly values far below retail; see NEM 3.0 explained.
Don’t assume the trend
Ten years of rises do not guarantee the next ten; the pace slowed in 2025–2026. Judge solar on today’s rates.
Run your own numbers
Where to go next
Cali Energy is a licensed Los Angeles solar, battery and electrical contractor (CSLB #1032379). Send us a recent bill and we will show what your own rate is and how much of it solar could replace. Call +1-323-844-7777 or get a bill review.
Frequently asked
What is the average residential electricity price in California in 2026?
33.25¢ per kWh for January through July 2026, according to the EIA, and 33.61¢ in July. The U.S. average for January–July was 18.19¢.
How much have California electricity rates risen?
The state’s average residential price rose from 17.39¢ per kWh in 2016 to 32.54¢ in 2025, about 87%, by EIA figures. The fastest years were 2021–2024.
Why is the number sometimes shown as ~27¢ instead of ~33¢?
That is the all-sector average, which includes businesses and industry: 27.79¢ per kWh in January–July 2026. The residential average is 33.25¢.
Did rates rise faster than inflation?
Yes. From 2016 to 2025 California’s residential price rose 87% while the consumer price index rose 34%, more than 2.5 times as fast. The U.S. electricity average rose 38%.
What is SCE’s average residential rate in 2026?
SCE puts it at 34.4¢ per kWh, rising to 34.5¢ on October 1, 2026 (33.3¢ after the California Climate Credit). By EIA’s utility data, SCE’s full-service residential average was 15.84¢ in 2016 and 32.43¢ in 2024.
Which California utility has the highest electricity rates?
Among the large utilities, SDG&E: 43.63¢ per kWh on average for residential customers in 2024, against 39.62¢ for PG&E, 32.43¢ for SCE and 23.84¢ for LADWP (EIA-861).
Does this mean my bill will keep going up?
Not necessarily at the same pace: the average rose about 2% in 2025 and 2.5% so far in 2026. Your bill also depends on your utility, rate plan and usage.
How does this affect whether solar is worth it?
Solar you use yourself saves the retail price, so higher rates make self-use more valuable. Exports are paid differently, and LADWP and SCE treat them very differently, so run the numbers for your own utility.
Related reading
Sources & methodology
Figures on this page come from the primary sources below and, where noted, from Cali Energy calculations using the stated assumptions. Rates, incentives, and program terms change; each was verified October 5, 2026.
- EIA — Electric Power Monthly, Table 5.6.B (year to date through July 2026)
- EIA — Electric Power Monthly, Table 5.6.A (July 2026)
- EIA — Electric Power Monthly, February 2026 (full-year 2025, preliminary)
- EIA — Electric Power Annual, Table 2.10 (2024 and 2023)
- EIA — Electric Power Monthly, February 2023 (full-year 2022 and 2021)
- EIA — Average price by state, annual, 1990–2020
- U.S. Bureau of Labor Statistics — Consumer Price Index (CPI-U, annual averages)
- EIA — Form EIA-861 annual utility data, Sales to Ultimate Customers (2016–2024 final, 2025 early release)
- SCE — Rate advisory: average residential rate and bill change, October 1, 2026
- EIA — Electric Power Monthly, June 2026 (April 2026 by state)
Turn a rising rate into a fixed cost
Send us a recent bill and we’ll show your own rate and how much of it solar could replace. Estimates, not guarantees.
Get a free estimatePrepared by Cali Energy, October 5, 2026. This article is for general educational purposes only and is not legal, tax, financial, engineering, or utility advice. Rates, incentives, codes, permit requirements, equipment specifications, prices, and program terms may change; figures and timelines are estimates, not guarantees. Confirm current requirements with the applicable utility, AHJ, program administrator, manufacturer, or a licensed professional. See our Content Disclaimer. Cali Energy · 19201 Parthenia St, Unit E, Northridge, CA 91324 · CSLB #1032379 (B, C-10, C-39)