

San Fernando Valley electricity rates in 2026
Your city line decides your power bill more than almost anything else in the Valley. Most of it is LADWP, but Burbank and Glendale run their own utilities and the western and northern edges are on SCE — four schedules built four different ways. Below: who serves your address, and what the same month of electricity costs on each, from the utilities' own published rates.
Get a free estimate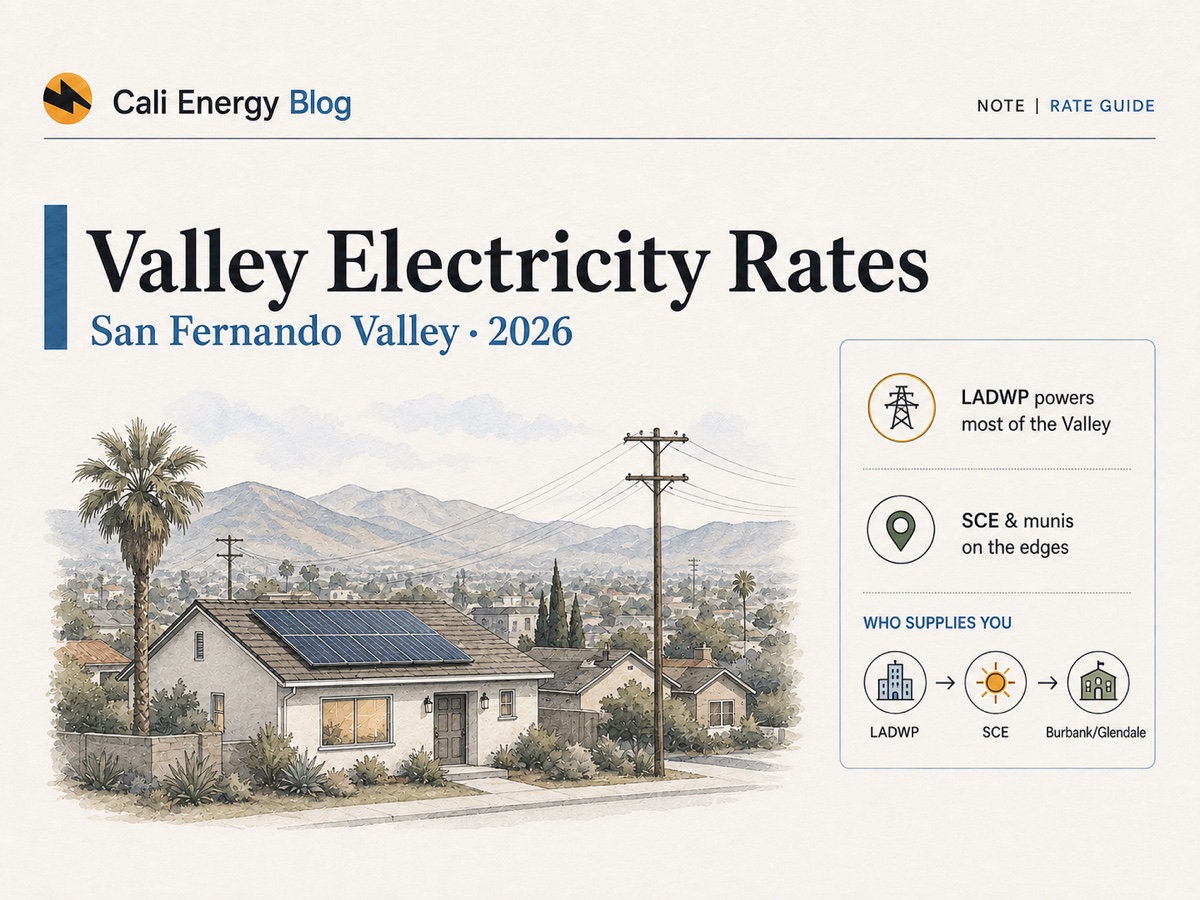
Quick answer
- Four utilities serve the Valley. Most of it — Northridge, Van Nuys, Encino, Woodland Hills, Reseda, Sherman Oaks and the rest of the City of Los Angeles — is LADWP. Burbank and Glendale run their own. Santa Clarita, the City of San Fernando, Calabasas and Agoura Hills are SCE.
- The same 750 kWh summer month costs about $201 in Burbank, $243 on LADWP, $279 on SCE and $297 in Glendale — a $96 spread on identical usage, before anyone changes a habit.
- Glendale is the expensive one, not the cheap one. Its published summer rate reaches 45.47¢/kWh on usage above the second tier — higher than LADWP's top summer tier and higher than SCE's off-peak.
- Only SCE customers are on NEM 3.0. LADWP, Burbank and Glendale are municipal utilities running their own net-metering rules, which is why the solar maths differs across a city line.
- These are rate structures, not one number. LADWP and Glendale bill in tiers, SCE by time of day, Burbank in two blocks — so “who is cheapest” depends on how much you use and when.
The same house, four Valley utilities
Identical usage, identical billing period, each utility's own published structure — including its fixed charges and the city tax where one applies.
Cali Energy calculation from each utility's published residential schedule. LADWP includes the Power Access Charge and the 10% City of Los Angeles Electricity Users Tax, and applies its $10 minimum bill. Burbank uses the composite energy + ECAC rate plus the Customer Service and small Service Size charges. Glendale uses L-1-A, whose tiers are 10 kWh per day of the billing period, plus the $0.75/day customer charge. SCE models TOU-D-4-9PM (rates from October 1, 2026) with the 9¢/kWh baseline credit and the $0.79/day Base Services Charge, at an illustrative 12 kWh/day baseline allocation. A 30-day period is assumed. Two LADWP details worth knowing: the Power Access Charge is set by your highest month in the past twelve rather than by the current month, so a household with a hotter peak month pays a higher one than modelled here; and the summer figures are LADWP’s July–September rate period — June is also high season but carries its own, slightly lower Tier 3 rate, and the winter option uses January–March 2026. Estimates for comparison, not bills — your own plan, baseline region and billing days will move them.
Who serves your address
By city, with the rate structure each one actually uses.
| Area | Utility | How the rate is built |
|---|---|---|
| Northridge, Van Nuys, Encino, Woodland Hills, Tarzana, Reseda, Canoga Park, Sherman Oaks, North Hollywood, Granada Hills, Chatsworth, Sylmar, Panorama City, Sun Valley — and the rest of the City of Los Angeles | LADWP | Tiered R-1A, three tiers, seasonal. Optional time-of-use R-1B. Billed every two months for most homes. 10% city tax. |
| Burbank | Burbank Water & Power | Two blocks: first 300 kWh a month, then everything above. Energy plus a monthly ECAC adjustment. |
| Glendale | Glendale Water & Power | Three tiers sized by billing days (10 kWh per day each), separate High Season Jul–Oct. Daily customer charge. |
| Santa Clarita, City of San Fernando, Calabasas, Agoura Hills | SCE | Time-of-use: price depends on the hour, with an expensive weekday evening peak. Baseline credit on standard plans. |
Utility assignments follow city boundaries; a handful of addresses near a boundary can differ, and the utility named on your bill is the authority. Local project pages: Northridge, Van Nuys, Encino, Woodland Hills, Burbank, Glendale, Santa Clarita.
The 2026 rates behind the comparison
Each from the utility's own schedule.
| Utility / schedule | Structure | Summer | Winter | Fixed charges |
|---|---|---|---|---|
| LADWP R-1A | Tier 1 / 2 / 3 | 26.408 / 32.267 / 40.968¢ | 24.771 / 30.630 / 30.630¢ | Power Access Charge $2.30 / $7.90 / $22.70 by tier; +10% city tax; $10 minimum |
| LADWP R-1B (opt-in TOU) | Base / Low Peak / High Peak | 26.540 / 29.284 / 35.124¢ | 25.293 / 27.647 / 27.647¢ | $12.00 per month; +10% city tax |
| Burbank Water & Power | First 300 kWh / above | 18.00¢ / 27.82¢ (energy + ECAC, no season split) | Customer Service $19.50 + Service Size from $2.18 | |
| Glendale Water & Power L-1-A | Three tiers of 10 kWh × billing days | 30.71 / 38.06 / 45.47¢ | 25.75 / 31.89 / 39.35¢ | $0.75 per day |
| SCE TOU-D-4-9PM | Peak 4–9 p.m. weekdays / off-peak | ~58¢ / ~34¢ | ~51¢ / ~37¢ | $0.79 per day; 10¢/kWh baseline credit |
Sources: LADWP Schedule R-1 (Total Consumption Charge tables, which already include LADWP's quarterly adjustment factors) · Burbank Water & Power electric rates · Glendale Water & Power residential rates · SCE time-of-use plans. SCE per-kWh figures are approximate summer values and vary by baseline region.
What the comparison actually shows
At a middling 750 kWh summer month, the ranking is Burbank, then LADWP, then SCE, then Glendale — and the gap between the cheapest and dearest is about $96 on identical usage. Three things are worth pulling out of that:
Glendale is not the mid-priced option. Its High Season top tier is 45.47¢/kWh, above LADWP's summer Tier 3 (40.968¢) and well above SCE's off-peak. Glendale households feel this most in July through October, when the seasonal rate applies.
Burbank's advantage is in the energy rate, not the fixed charges. BWP charges more up front than LADWP — about $21.68 a month against LADWP's $7.90 Power Access Charge at Tier 2 — but its 27.82¢ block rate is low enough that the fixed charge is repaid well before a typical Valley bill.
SCE's position depends entirely on the clock. At 20% of usage in the 4–9 p.m. window it sits third; push that to 35% and it passes Glendale to become the most expensive. That lever does not exist on the three municipal tariffs, which is why the advice for an SCE household is different in kind, not just in degree — see SCE time-of-use plans compared.
Why this matters for solar
The utility line changes the economics, not just the price.
If you are on SCE and interconnected on or after April 15, 2023, you are on the CPUC's Net Billing Tariff — NEM 3.0 — where exported energy earns far less than imported energy costs. That is what makes batteries and self-consumption central to an SCE solar design. LADWP, Burbank and Glendale are municipal utilities and are not on NEM 3.0; they run their own net-metering programmes, and LADWP in particular still credits exports at the retail rate. Two houses either side of the Burbank city line can therefore justify very different systems. The export rules are in NEM 3.0 explained, and the LADWP tariff in depth is in LADWP electric rates explained.
One more 2026 change that applies regardless of utility: the 30% federal Residential Clean Energy Credit is not available for homeowner-owned systems placed in service after December 31, 2025. Any payback maths built on it needs redoing.
What this page cannot tell you
It cannot tell you which LADWP zone your address is in — the per-kWh rates are identical in both, but the tier thresholds differ (350 and 1,050 kWh a month in Zone 1 against 500 and 1,500 in Zone 2), and LADWP does not publish a simple ZIP-to-zone lookup. Your zone appears on your bill. It also cannot tell you your SCE baseline region, which moves the SCE figure, or confirm the utility for an address sitting on a city boundary.
Every figure here is a published residential schedule, not your bill. Utilities revise on their own timetables — LADWP quarterly, Burbank under a multi-year approval, SCE through the CPUC — so check the linked schedule before making a decision that depends on the exact number.
Frequently asked
Which electric utility serves my San Fernando Valley home?
Which Valley utility is cheapest?
Is Glendale Water & Power cheap because it is municipal?
Why is my LADWP bill so high compared to the rate?
Does NEM 3.0 apply to me in the Valley?
Did Burbank's rates go up in 2026?
Related reading
Sources & methodology
Figures on this page come from the primary sources below and, where noted, from Cali Energy calculations using the stated assumptions. Rates, incentives, and program terms change; each was verified September 8, 2026.
- LADWP — Schedule R-1 Residential Service (R-1A and R-1B Total Consumption Charge, Power Access Charge)
- LADWP — Residential Electric Rates (tier thresholds, zones, TOU periods, bi-monthly billing)
- Burbank Water & Power — Residential electric rates (tiers, ECAC, service charges)
- Burbank Water & Power — Approved rate increases (9.9% system-wide average, eff. Jan 1 2026)
- Glendale Water & Power — Residential electric rates (schedule L-1-A)
- SCE — Time-of-Use Residential Rate Plans
- CPUC — Net Billing Tariff (NEM 3.0)
- IRS — Residential Clean Energy Credit
- U.S. EIA — Electric Power Monthly, Table 5.6.A (average residential price by state)
Solar maths changes at the city line
Whether a battery pays for itself depends on which of these four utilities serves you and which net-metering rules you fall under. Cali Energy designs for all four — LADWP, SCE, Burbank and Glendale — with in-house crews and CSLB #1032379. Call +1 (323) 844-7777.
Get a free estimatePrepared by Cali Energy, September 8, 2026. This article is for general educational purposes only and is not legal, tax, financial, engineering, or utility advice. Rates, incentives, codes, permit requirements, equipment specifications, prices, and program terms may change; figures and timelines are estimates, not guarantees. Confirm current requirements with the applicable utility, AHJ, program administrator, manufacturer, or a licensed professional. See our Content Disclaimer. Cali Energy · 19201 Parthenia St, Unit E, Northridge, CA 91324 · CSLB #1032379 (B, C-10, C-39)