

Why Is My Electric Bill Higher in 2026?
A higher bill usually comes down to a few things: the rate changed, your usage went up (often air conditioning), the billing period was longer, or a credit or fixed charge changed. This guide walks through each cause for SCE and LADWP with October 2026 numbers, shows what statewide data say about price versus usage, and gives you a diagnostic table to find what moved your own bill.
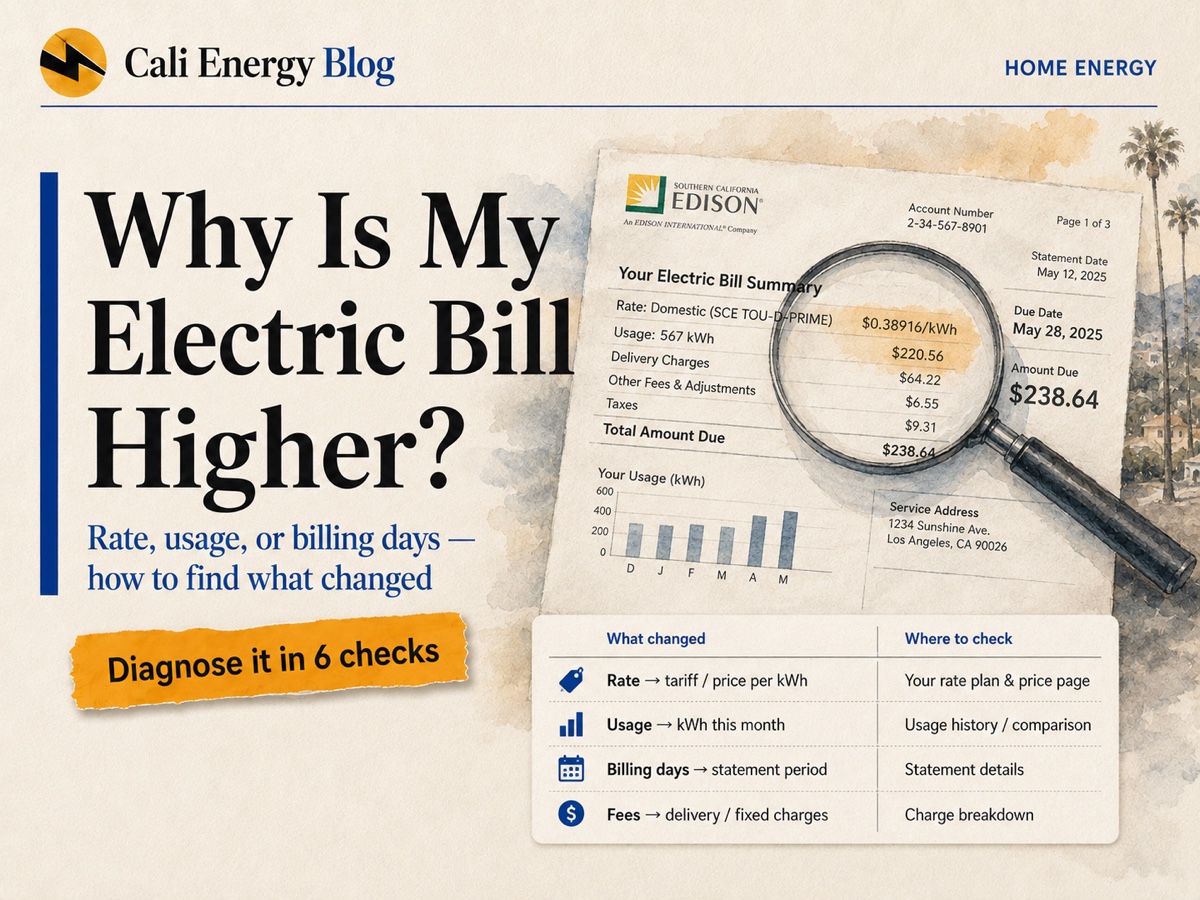
- Three things move a bill: the rate, your usage, and how many days the bill covers. Check all three.
- Statewide, the average California home bill in January–July 2026 was about 5% higher than a year earlier — and roughly half of that came from using more electricity, half from price.
- October bills have their own reasons: on SCE, no Climate Credit after September and the switch to winter prices; on LADWP, higher prices from October 1 and a Power Access Charge reset to your hottest month.
- Compare usage per billing day, not just total kWh — billing periods differ in length.
The main reasons a 2026 bill is higher
- SCE’s rates rose again on October 1, 2026. The average residential rate went from 34.4¢ to 34.5¢/kWh; SCE estimates a typical TOU-D-4-9PM home using 500 kWh a month goes from $185.85 to $188.64 (+$2.79, or 1.5%). SCE attributes it to its 2025 General Rate Case shifting a slightly larger share of costs to homes, and to Woolsey Fire costs: $49.7 million for restoration and $140.1 million for the bonds that financed wildfire claims. For the longer story, see why SCE rates are so high.
- Summer AC on peak. Air conditioning runs during SCE’s 4–9 p.m. window, where summer electricity costs 59¢/kWh on TOU-D-4-9PM and 72¢ in the 5–8 p.m. peak of TOU-D-5-8PM. See how much electricity AC uses.
- LADWP’s prices are up about 11% on a year ago. From October 1, 2026, Tier 1 costs 27.29¢/kWh, against 24.60¢ in October–December 2025; in summer, Tier 3 reached 40.97¢. See LADWP rates explained.
- Two-month billing (LADWP). Many LADWP customers are billed every two months, so a summer bill shows roughly two months of charges at once — which reads like a spike.
- A fixed charge you pay regardless of use. Since November 2025, SCE bills a Base Services Charge of $24.15 a month; LADWP charges a Power Access Charge of $2.30 to $22.70 depending on your highest recent usage.
Sources: SCE rate advisory (October 1, 2026) · SCE time-of-use rates · SCE Base Services Charge · LADWP residential rates · verified October 6, 2026.
Why an October bill can be higher than September’s
Cooler weather usually means less AC, yet the first fall bill often surprises people. For SCE customers:
- No Climate Credit. In 2026 SCE’s residential Climate Credit was $36 on the August bill and $36 on September’s. An October bill has none, so the same usage costs $36 more than it did a month earlier.
- Winter prices are not lower everywhere. From October through May, TOU-D-4-9PM charges 50¢ for 4–9 p.m. every day (the summer weekend rate was 44¢) and 36¢ overnight (33¢ in summer). Only the 8 a.m.–4 p.m. super-off-peak, at 32¢, is cheaper.
- A smaller baseline credit. For a gas-heated home the winter baseline allowance is much smaller — in Region 10, 12.1 kWh a day instead of 19.3 — so the 9¢/kWh credit covers less of your usage. See SCE baseline regions.
For LADWP customers:
- New prices on October 1. Tier 1 rose from 26.41¢ to 27.29¢/kWh, although the summer Tier 3 premium ended. A two-month bill that spans the change is split across the old and new prices by billing days.
- The Power Access Charge resets every October 1, based on your highest month of the past twelve. A hot summer that pushed one month into Tier 3 can raise the monthly charge from $7.90 to $22.70 for the next year.
Sources: CPUC — California Climate Credit · SCE time-of-use rates · LADWP — residential rates explained (Power Access Charge) · LADWP rate schedules · verified October 6, 2026.
Price or usage? What the statewide numbers show
EIA’s monthly utility survey gives the average bill, usage and price for California homes. Comparing the first seven months of 2026 with the same months of 2025:
| Month | Bill 2025 | Bill 2026 | kWh per home | Price per kWh | Change |
|---|---|---|---|---|---|
| Jan | $166.75 | $182.84 | 551 → 604 | 30.3¢ → 30.3¢ | +$16.09 |
| Feb | $145.09 | $139.61 | 457 → 420 | 31.7¢ → 33.2¢ | −$5.48 |
| Mar | $133.25 | $153.88 | 410 → 461 | 32.5¢ → 33.4¢ | +$20.63 |
| Apr | $129.02 | $138.20 | 382 → 392 | 33.8¢ → 35.2¢ | +$9.18 |
| May | $130.21 | $135.51 | 391 → 408 | 33.3¢ → 33.2¢ | +$5.30 |
| Jun | $161.72 | $164.72 | 481 → 474 | 33.6¢ → 34.7¢ | +$3.00 |
| Jul | $186.70 | $191.76 | 572 → 571 | 32.7¢ → 33.6¢ | +$5.06 |
Over January–July the average bill was about 5.1% higher ($1,107 against $1,053 for the seven months). Splitting the change, higher prices added about $27 and higher usage about $27 — so for the average home, half of the increase was usage. The months show it: January and March bills jumped mainly because homes used more power, while the summer increases came from price. Monthly figures follow billing cycles, so they lag the weather by a few weeks.
Source: EIA-861M monthly sales, revenue and customers (file sales_revenue.xlsx, 2025–2026 preliminary) · Cali Energy calculation: bill = revenue ÷ customers; price effect = 2025 usage × price change; usage effect = usage change × 2026 price.
Diagnose your own bill
Pull up your current bill next to a recent one and check each row. Whichever line changed points you to the cause:
| What changed | Where to check | Likely explanation |
|---|---|---|
| kWh went up | Usage history / graph on the bill | AC, an EV, a pool pump, or a longer billing period |
| Rate went up | The per-kWh / tariff line | Seasonal change or a utility rate adjustment |
| Tier changed (LADWP) | Tier breakdown on the bill | Usage crossed into Tier 2 or Tier 3 |
| Peak share went up (SCE) | Time-of-use / interval data | More usage during the 4–9 p.m. peak |
| A fixed charge appeared or rose | Bill detail / line items | SCE Base Services Charge ($24.15/month); LADWP Power Access Charge reset on October 1 |
| A credit disappeared (SCE) | Credits section | The Climate Credit appears only on August and September bills |
| Baseline credit got smaller (SCE) | Baseline allocation line | Winter allowance is smaller for gas-heated homes |
| Bill covers more days | The billing-period dates | A longer cycle simply includes more usage |
Methodology tip: compare usage per billing day (total kWh ÷ number of days in the period), not only total kWh — billing-period length can differ from bill to bill and make a normal month look like a jump.
What you can and can’t control
Part of a higher bill is rate — set by the utility and the CPUC, outside your control. Part is usage — which you can influence by shifting large loads out of peak hours, improving efficiency, or offsetting daytime use with solar and a battery. To put numbers to your own situation, use our LADWP vs SCE bill estimator and AC operating-cost calculator, and see how to read your electric bill. These tools give estimates, not guarantees, and depend on the assumptions you enter.
Frequently asked
Why is my electric bill so much higher in summer?
Why is my October bill higher than September’s?
Did SCE raise rates in 2026?
Why did my LADWP bill jump if the rate barely changed?
How do I tell whether it was my usage or the rate?
Can solar or a battery lower a high summer bill?
Related reading
Sources & methodology
Figures on this page come from the primary sources below and, where noted, from Cali Energy calculations using the stated assumptions. Rates, incentives, and program terms change; each was verified October 6, 2026.
- SCE — Rate advisory (October 1, 2026 change and bill impacts)
- SCE — Time-of-Use residential rate plans (rates from October 1, 2026)
- SCE — Base Services Charge
- CPUC — California Climate Credit
- LADWP — Residential rate schedules (2025–2026)
- LADWP — Residential electric rates (Power Access Charge reset)
- EIA — Form EIA-861M monthly sales, revenue and customers
- CPUC — Southern California Edison General Rate Case
About this guide
This reference is maintained by the Cali Energy research team to help California homeowners understand what moves an electric bill. Figures are illustrative and change with utility tariffs; confirm current rates with your utility.
Prepared by Cali Energy, October 6, 2026. This article is for general educational purposes only and is not legal, tax, financial, engineering, or utility advice. Rates, incentives, codes, permit requirements, equipment specifications, prices, and program terms may change; figures and timelines are estimates, not guarantees. Confirm current requirements with the applicable utility, AHJ, program administrator, manufacturer, or a licensed professional. See our Content Disclaimer. Cali Energy · 19201 Parthenia St, Unit E, Northridge, CA 91324 · CSLB #1032379 (B, C-10, C-39)