

Electricity rates in Los Angeles (2026): what LADWP and SCE actually charge
There is no single Los Angeles electricity rate — the price is set by whichever utility serves the address. LADWP, which serves the City of Los Angeles, charges 26.408¢ per kWh in Tier 1 from July through September 2026 on its standard R-1A rate, before its monthly Power Access Charge and before the City's 10% electricity users tax. Southern California Edison, which serves much of the rest of LA County, prices most homes by time of day; its bundled residential customers were on an average rate of 34.4¢ per kWh in June 2026 according to the CPUC Public Advocates Office — a figure that excludes the California Climate Credit and does not cover accounts that buy their generation from a community choice aggregator.
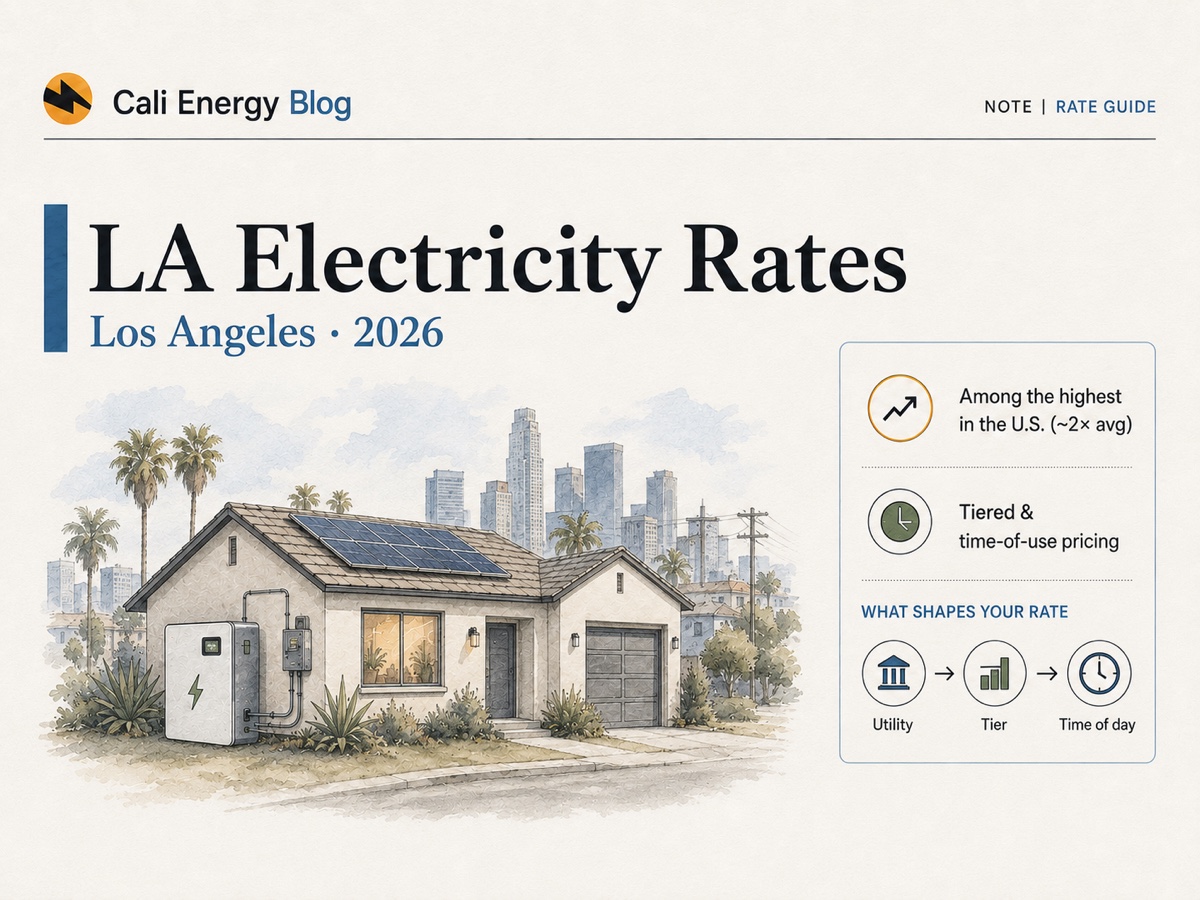
Those two numbers are not the same kind of number, and that difference is the whole subject of this page. 26.408¢ is a tariff price — an exact figure LADWP publishes for a specific tier, in a specific quarter, that every R-1A customer is charged. 34.4¢ is a regulatory average rate — SCE's authorised bundled residential revenue requirement divided by its forecast bundled residential sales, calculated by the CPUC Public Advocates Office. It excludes the California Climate Credit, which the Public Advocates Office says lowers the figure by roughly 2–3¢, and it excludes the accounts that buy generation from a community choice aggregator. Comparing one directly against the other tells you almost nothing.
So this page does four things in order: helps you work out which utility serves you, gives the exact published LADWP prices and SCE’s plan prices as SCE displays them, then prices the same 500 kWh month on four plans with the fixed charges, credits and city tax that headline rates leave out. At the end there is a five-minute method for checking your own effective rate and for finding the levers that actually move it.
Step 1: which utility serves your address
This decides everything else on the page, and it is not something you can infer from a neighborhood name.
Service boundaries do not follow city limits or neighborhood labels cleanly. If you have a bill, the fastest method is the least clever one: read the utility name printed at the top of it. If you do not — you are moving, buying, or comparing two addresses — use the utility's own address lookup: LADWP and SCE both check whether an address is in their territory when you start service, and SCE's Index of Communities lists every community it serves.
Two rules of thumb that hold up: inside the City of Los Angeles you are on LADWP, and that includes places people often assume are separate, like Venice, San Pedro, Woodland Hills and Sylmar. Cities that are not the City of Los Angeles are usually not on LADWP — Santa Monica, Culver City, Torrance and West Hollywood are SCE territory even though they sit inside or against the city's footprint. Burbank, Glendale, Pasadena, Azusa and Vernon run their own utilities entirely. Where a boundary genuinely splits a neighborhood, only the address settles it.
| Provider | Type | Serves | Residential rate structure |
|---|---|---|---|
| LADWP | Municipal (city-owned) | City of Los Angeles | Tiered by usage (R-1A); time-of-use optional (R-1B) |
| Southern California Edison | Investor-owned | Much of LA County outside the city, plus a large territory beyond it | Time-of-use by default (TOU-D plans) |
| Clean Power Alliance | Community choice aggregator | 38 communities in LA and Ventura counties, including unincorporated LA County | Sets the generation price only; SCE still delivers, reads the meter and sends one combined bill |
| Burbank Water & Power | Municipal | Burbank | Its own published residential schedule |
| Glendale Water & Power | Municipal | Glendale | Its own published residential schedule |
| Pasadena Water & Power | Municipal | Pasadena | Its own published residential schedule |
| Azusa Light & Water | Municipal | Azusa | Its own published residential schedule |
| Vernon Public Utilities | Municipal | Vernon | Its own published residential schedule |
Sources: LADWP residential rates · SCE time-of-use residential rate plans · Clean Power Alliance FAQs · California Energy Commission — electric load-serving entities, the authoritative full register. Verified August 12, 2026. Community choice aggregators other than Clean Power Alliance operate elsewhere in the region; this table covers the providers serving the great majority of LA-area households.
If your bill says SCE, check whether a second supplier is also on it
Roughly 1.37 million residential accounts on SCE's wires — about 30% of all residential accounts in its territory — bought their electricity generation from someone other than SCE in 2024. In Los Angeles County that is almost entirely Clean Power Alliance. Those customers still get one SCE bill and pay SCE's delivery charges and time-of-use periods, but the generation line comes from the aggregator at the aggregator's price. If that is you, "the SCE rate" describes only part of your bill, and both the comparison below and the 34.4¢ benchmark assume SCE supplies the generation.
Account counts from EIA Form EIA-861, data year 2024: 1,374,895 delivery-only residential accounts against 3,219,520 bundled. EIA's delivery-only category covers community choice aggregation and direct access; residential direct access has been closed to new enrolment in California since 2001. Accounts are meters, not households or people. Enrolment is by community, and any customer may opt out.
LADWP: the published 2026 price, tier by tier
LADWP publishes an exact figure for every tier and every period. There is no need to estimate it.
LADWP's standard residential rate is R-1A, and it is tiered: the more you use in a billing period, the higher the price of the last kilowatt-hour. Three things set your price — your zone (which changes how much fits in each tier, not the price), the season (high season is June through September; low season is October through May) and the quarter, because LADWP republishes its adjustment factors in January, April, July and October.
| Billing period | Season | Tier 1 | Tier 2 | Tier 3 | Tier 1 a year earlier |
|---|---|---|---|---|---|
| January – March | Low | 24.771 | 30.630 | 30.630 | 22.296 |
| April – May | Low | 24.362 | 30.221 | 30.221 | 22.765 |
| June | High | 24.362 | 30.221 | 38.922 | 22.765 |
| July – September | High | 26.408 | 32.267 | 40.968 | 24.306 |
| October – December | Low | Not yet published by LADWP as of August 12, 2026 | 24.604 | ||
Published by LADWP as the R-1A Total Consumption Charge: LADWP — Residential rates (2026 and 2025 tables). Excludes the Power Access Charge and the City of Los Angeles electricity users tax. Zones share the same prices and differ only in tier sizes. Verified August 12, 2026.
June is its own row for a reason. June is high season, so Tier 3 pricing kicks in — but June still sits inside the April–June adjustment quarter, so it carries the lower set of factors. A June Tier 3 kilowatt-hour costs 38.922¢; the same kilowatt-hour in July costs 40.968¢. Rate summaries that jump straight from "April–May" to "July–September" skip a month in which a lot of air conditioning runs.
If your usage regularly averages 3,000 kWh a month or more, LADWP requires service on its time-of-use rate rather than R-1A. That rate, R-1B, is also optional for anyone else, and its shape is unusual: the high-peak window is weekday afternoons, not evenings.
| Billing period | High peak weekdays 1:00–4:59 p.m. | Low peak weekdays 10 a.m.–12:59 p.m. & 5–7:59 p.m. | Base weekdays 8 p.m.–9:59 a.m. & all weekend |
|---|---|---|---|
| January – March | 27.647 | 27.647 | 25.293 |
| April – May | 27.238 | 27.238 | 24.884 |
| June | 33.078 | 27.238 | 24.494 |
| July – September | 35.124 | 29.284 | 26.540 |
| October – December | Not yet published by LADWP as of August 12, 2026 | ||
Published by LADWP as the R-1B Total Consumption Charge, with the TOU schedule days and hours: LADWP — Residential rates · LADWP — Residential electric rates (TOU hours; the high-peak period is 20 hours a week). R-1B carries a $12.00 monthly service charge instead of the Power Access Charge. Verified August 12, 2026. Note the contrast with SCE: LADWP's most expensive hours are early weekday afternoons, when rooftop solar is producing hardest, while SCE's are weekday evenings, when it is not.
How LADWP's price is actually built
Base rate plus seven pass-through factors. Both halves are published, so the total is checkable.
LADWP publishes the finished price, and it also publishes the ingredients — which is worth looking at, because it explains why the bill moves when no rate increase was announced. The price is a base energy charge set by City rate ordinance, plus seven pass-through adjustment factors that LADWP republishes every quarter. The base energy charge has not changed since July 1, 2019, so every cent of the 2026 increase arrived through the adjustment factors.
| Component | Tier 1 | Tier 2 | Tier 3 |
|---|---|---|---|
| Base energy charge (unchanged since July 1, 2019) | 0.07142 | 0.13001 | 0.21702 |
| ECA — energy cost adjustment | 0.05690 | 0.05690 | 0.05690 |
| ESA — electric subsidy adjustment | 0.00147 | 0.00147 | 0.00147 |
| RCA — reliability cost adjustment | 0.00300 | 0.00300 | 0.00300 |
| IRCA — incremental reliability cost adjustment | 0.06934 | 0.06934 | 0.06934 |
| VEA — variable energy adjustment | 0.01071 | 0.01071 | 0.01071 |
| CRPSEA — cumulative renewable portfolio standard energy adjustment | 0.01817 | 0.01817 | 0.01817 |
| VRPSEA — variable renewable portfolio standard energy adjustment | 0.03307 | 0.03307 | 0.03307 |
| Total charged per kWh | 0.26408 | 0.32267 | 0.40968 |
Base energy charges and the seven adjustment factors as published by LADWP: Residential rates (base rates effective July 1, 2019, and the total consumption charge) · Residential adjustment billing factors (2026 and 2025 quarterly tables). The base rates trace to LADWP's electric rates ordinance plus the final incremental ordinance of 4-15-16, whose last step took effect July 1, 2019. Cali Energy checked the addition: the totals in this table equal LADWP's own published figures to five decimal places for all three tiers across all three published 2026 quarters. Verified August 12, 2026.
Because the base is fixed, the whole year-over-year change sits in the factors. Summing them for each quarter and comparing with the same quarter of 2025:
- January–March: 15.154¢ → 17.629¢, an increase of 2.475¢ per kWh
- April–June: 15.623¢ → 17.220¢, an increase of 1.597¢ per kWh
- July–September: 17.164¢ → 19.266¢, an increase of 2.102¢ per kWh
Those deltas match the change in LADWP's own published totals exactly — Tier 1 went 22.296¢ → 24.771¢, 22.765¢ → 24.362¢ and 24.306¢ → 26.408¢. The single largest mover was the IRCA, the incremental reliability cost adjustment, which rose from 0.05505 to 0.06934 dollars per kWh between the second and third quarters of 2026. In July–September 2026, adjustment factors make up 19.266¢ of the 26.408¢ Tier 1 price — about 73% of what a Tier 1 customer pays per kilowatt-hour is pass-through, not base rate.
The LADWP charges that are not per-kWh
Power Access Charge
A monthly fixed charge set by the highest tier you reached in the previous 12 months: $2.30 at Tier 1, $7.90 at Tier 2, $22.70 at Tier 3. LADWP re-scores it every October 1, so one hot summer can raise your fixed charge for the following year — and dropping a tier lowers it. R-1A also carries a $10 monthly minimum charge plus adjustment factors.
City electricity users tax
The City of Los Angeles adds 10% to residential electricity charges (12.5% for commercial and industrial). It applies to the whole bill including customer, service and minimum charges — so it lands on the Power Access Charge too, not just on consumption. The City exempts some low-income seniors and people with disabilities, on application.
Your zone changes the tier sizes
In Zone 1, Tier 1 covers the first 350 kWh a month, Tier 2 the next 700, Tier 3 everything above 1,050. In the hotter Zone 2 the allowances are larger: 500, then 1,000, then above 1,500. Same prices, more room before you climb. Look up your zone →
Bi-monthly billing on most residential accounts
A single statement usually covers two months, and the tier thresholds are exactly doubled for that cycle — 700 kWh in Zone 1 Tier 1 instead of 350. Steady usage lands in the same tiers either way; a bill that looks alarming often just covers twice as long.
Sources: LADWP — Residential rates (Power Access Charge amounts, $10 minimum charge) · LADWP — Residential electric rates (tiers by zone, seasons, annual October 1 re-score, billing frequency) · Los Angeles Municipal Code §21.1.4, electricity users tax and §21.1.12, exemptions. Verified August 12, 2026.
SCE: the published 2026 plan prices
Southern California Edison prices by time of day, not by how much you use.
SCE puts most homes on a time-of-use plan, where the price depends on when the electricity is used. Summer is June through September; winter is October through May. In summer, weekends are priced differently from weekdays — the same evening window becomes a cheaper mid-peak instead of on-peak. In winter, weekdays and weekends are priced the same. These are SCE's published plan prices, shown rounded to the cent as SCE displays them; the filed tariff sheets carry more decimal places.
| Plan | Evening window | Summer weekday on-peak | Summer weekend mid-peak | Summer off-peak | Winter mid-peak | Winter off-peak | Winter super off-peak |
|---|---|---|---|---|---|---|---|
| TOU-D-4-9PM | 4–9 p.m. | 58 | 46 | 34 | 51 | 37 | 33 |
| TOU-D-5-8PM | 5–8 p.m. | 74 | 54 | 34 | 60 | 38 | 32 |
| TOU-D-PRIME | 4–9 p.m. | 59 | 40 | 26 | 56 | 24 | 24 |
Source: SCE — time-of-use residential rate plans. Summer is June–September, winter October–May; winter prices apply to weekdays and weekends alike, and winter super off-peak runs from 8 a.m. TOU-D-PRIME requires a qualifying electric vehicle, battery or heat pump. Prices exclude the Base Services Charge, the baseline credit and the California Climate Credit. Verified August 12, 2026.
Base Services Charge: $24.15 a month
Since November 2025, under California Assembly Bill 205, SCE bills a fixed Base Services Charge in place of the old basic charge: $24.15 a month for most customers, $12.08 for FERA households and qualifying deed-restricted affordable housing, and $6.00 for CARE households. SCE's plan pages express the standard amount as $0.79 per day. SCE says the change reduced the per-kWh price by about 10%.
Baseline credit: −10¢ per kWh
On TOU-D-4-9PM and TOU-D-5-8PM, SCE credits 10¢ per kWh up to your monthly baseline allocation — which is why SCE also publishes an "after baseline credit" on-peak price of 48¢ instead of 58¢. The allocation depends on your baseline region and varies widely. TOU-D-PRIME has no baseline credit. Find your baseline region and allowance →
Sources: SCE — Base Services Charge (amounts by program, AB 205, and the equivalent daily charges of roughly 80, 40 and 20 cents) · SCE — time-of-use residential rate plans. Verified August 12, 2026.
The same 500 kWh month, priced on four plans
Headline cents per kWh leave out the charges that decide the total. This puts them back in.
A price per kilowatt-hour is not a bill. Fixed charges, baseline credits and city taxes can move the effective rate by several cents, and they move it differently on each plan. Below, the identical month — 500 kWh in July 2026, with 100 kWh of it falling in the weekday 4–9 p.m. window — is priced on LADWP's standard rate and SCE's three main residential plans, using the published prices above.
| Cost component | LADWP R-1A (Zone 1) | SCE TOU-D-4-9PM | SCE TOU-D-5-8PM | SCE TOU-D-PRIME |
|---|---|---|---|---|
| Energy charges | $140.83 | $194.00 | $210.00 | $163.00 |
| Fixed charge | $7.90 | $24.15 | $24.15 | $24.15 |
| Baseline credit | — | −$35.00 | −$35.00 | none |
| Total before local tax | $148.73 | $183.15 | $199.15 | $187.15 |
| Effective price per kWh | 29.75¢ | 36.63¢ | 39.83¢ | 37.43¢ |
| Local utility users tax | +10% in the City of LA → $163.60 | Varies by city; not included | ||
Illustrative calculation by Cali Energy, not a bill estimate. Assumptions: 500 kWh in one July 2026 billing month; LADWP Zone 1 with monthly-equivalent tiering (350 kWh at 26.408¢ + 150 kWh at 32.267¢) and the Power Access Charge at Tier 2; on every SCE plan, 100 kWh in the weekday evening peak window and 400 kWh off-peak, with no usage in the cheaper summer weekend mid-peak. A household with heavy weekend afternoon load lands below these figures if that load replaces weekday peak hours, and above them if it replaces off-peak hours — on TOU-D-4-9PM, moving 80 kWh from off-peak into the weekend mid-peak window raises the effective rate from 36.63¢ to 38.55¢. Other assumptions: a 350 kWh monthly baseline allocation for the SCE baseline credit, since real allocations vary by baseline region; non-CARE; excludes local utility users taxes and the California Climate Credit; TOU-D-PRIME requires a qualifying EV, battery or heat pump. Your own peak split, zone, baseline region and tier history will all change the result.
The peak window matters more than the peak price
TOU-D-5-8PM has the scariest headline — 74¢ per kWh — yet its peak window is only three hours instead of five. Under the assumptions above, the two plans cost the same when about 60 kWh, or 12% of the month, lands in the 5–8 p.m. window, versus 100 kWh, or 20%, in the 4–9 p.m. window. Below that share the shorter window wins despite the higher price; above it, it loses. That is the trade the plan is offering, and no headline rate expresses it. Compare SCE's plans in detail →
Solving 0.74x + 0.34(500 − x) = 0.58(100) + 0.34(400) gives x = 60 kWh. Holds only for this usage and these published prices; it is arithmetic from the assumptions above, not a recommendation to switch plans, and plan changes have their own eligibility and lock-in rules.
What LADWP and SCE customers were charged, on average
Averages answer a different question than tariffs do — useful for checking whether your own bill is normal.
A tariff tells you the price of the next kilowatt-hour. An average tells you what a whole customer base ended up paying per kilowatt-hour once fixed charges, taxes, tiers and seasons washed through. The most recent figures that report LADWP and SCE on the same definition come from the U.S. Energy Information Administration's annual utility survey, for data year 2024.
| Utility | Average price per kWh | Average use per account | Average monthly amount billed | Residential accounts |
|---|---|---|---|---|
| LADWP | 23.84¢ | 485 kWh/month | $115.63 | 1,410,191 |
| SCE (bundled) | 32.43¢ | 506 kWh/month | $164.02 | 3,219,520 |
| SCE (delivery only) | 17.90¢ delivery only | 477 kWh/month | $85.41 delivery only | 1,374,895 |
Cali Energy calculation from U.S. EIA Form EIA-861 detailed data files, Sales_Ult_Cust_2024.xlsx, utility 11208 (LADWP) and utility 17609 (SCE). Price = residential revenue ÷ residential sales; use and amount = totals ÷ accounts ÷ 12. Per EIA's instructions this revenue is gross and includes fixed charges, surcharges, franchise fees and state and local taxes — so it is not comparable to a tariff price. Accounts are meters, not households or people. SCE's figures cover its entire territory, which extends well beyond Los Angeles County. The delivery-only row is not anyone's full price: those customers pay a community choice aggregator separately for generation; it is shown to size that population. Verified August 12, 2026.
For SCE there is a more current official figure. The CPUC Public Advocates Office tracks a residential average rate for each investor-owned utility and put SCE at 34.4¢ per kWh in June 2026. Two limits come with it: it is a bundled figure, so it does not describe accounts whose generation comes from a community choice aggregator, and it excludes the California Climate Credit, which the Public Advocates Office says lowers the rate by roughly 2–3¢. On that basis SCE's residential rate is up 4% over three years, 56% over five and 101% over ten. LADWP has no equivalent, because as a city-owned utility it is not under CPUC rate jurisdiction; its rates are set by City ordinance.
Statewide and national benchmarks, for context: California's average residential price was 33.25¢ per kWh in May 2026 and the U.S. average was 18.44¢. EIA labels these monthly figures preliminary and revises them in later releases.
Sources: CPUC Public Advocates Office — Q2 2026 Electric Rates Report (published July 27, 2026; residential average rate is the bundled authorised revenue requirement divided by bundled forecast sales) · EIA Electric Power Monthly, Table 5.6.A (May 2026, preliminary). Verified August 12, 2026.
What changed in 2026 — and what did not
LADWP: up, entirely through pass-throughs
Base rates unchanged since July 2019. Adjustment factors added 2.475¢ more per kWh in Q1 2026 than in Q1 2025, 1.597¢ more in Q2 and 2.102¢ more in Q3. The October–December factors were not published as of August 12, 2026.
SCE: essentially flat in 2026
SCE's 2026 rate changes went slightly downward: the June 1, 2026 change was a bundled residential average rate decrease of about 0.1% relative to January 1, and the Public Advocates Office's end-of-2026 projection is 33.5¢ against 34.4¢ in June — a projection it says includes only known revenue requests and will likely rise as further requests are filed. "Rates always rise" is not what 2026 has done so far. What drove the earlier increases →
SCE's bill structure changed in late 2025
November 2025 replaced the old basic charge with the Base Services Charge under AB 205 — $24.15 a month for most customers, less for CARE and FERA — while cutting per-kWh prices by roughly 10%, per SCE. A fixed charge paired with cheaper kilowatt-hours shifts cost toward lower-usage accounts and away from higher-usage ones.
Solar export rules did not change
SCE remains under the CPUC's Net Billing Tariff; LADWP, as a municipal utility, runs its own net-metering rules. That difference is about exports, not about the import prices on this page. LADWP net metering → · SCE solar billing →
Sources: LADWP adjustment factors, 2026 and 2025 tables · CPUC Public Advocates Office Q2 2026 Electric Rates Report (June 1, 2026 rate change; forecast caveat) · SCE Base Services Charge. Verified August 12, 2026.
Check your own rate — and find the levers that move it
Your effective rate is a fact about your bill, not something you have to estimate.
- Find the utility name and plan code at the top of your bill. LADWP shows R-1A or R-1B; SCE shows a plan such as TOU-D-4-9PM. If a second supplier is listed, an aggregator provides your generation.
- Divide the total amount due by the kilowatt-hours the bill covers. Include every fixed charge, credit and tax. Multiply by 100 for cents per kWh. That is your effective rate — the only number that describes what you actually pay.
- Compare it to the right benchmark. LADWP customers: 23.84¢ was the 2024 utility-wide average, and the 2026 tariff runs 24.4–41.0¢ depending on tier and period, so an effective rate in the high twenties to low thirties is unremarkable once the Power Access Charge and the 10% city tax are in. SCE customers: the CPUC Public Advocates Office put the June 2026 bundled residential average rate at 34.4¢, before the California Climate Credit, which is worth about 2–3¢ — so an effective rate a few cents below it is expected, and if an aggregator supplies your generation this benchmark does not describe your bill.
- If your effective rate is well above the benchmark, check the three usual causes in order: how much usage reached Tier 3 or the evening peak; whether your Power Access Charge is stuck at a tier you no longer use; and whether your plan matches when you actually use electricity.
- Check the inputs you can change. LADWP customers can look up their zone; SCE customers can look up their baseline region and allowance, which sets the size of the baseline credit.
Three levers, in rough order of size. First, on LADWP, the Power Access Charge is the one fixed cost you can actually lower: keeping your highest month below the Tier 3 threshold moves it from $22.70 to $7.90, worth $14.80 a month — about $16.28 with the City's 10% tax — and LADWP re-scores it every October 1. Second, on SCE, moving load out of the weekday evening window is worth the gap between on-peak and off-peak: at the published summer prices that is 24¢ per kWh on TOU-D-4-9PM and 40¢ on TOU-D-5-8PM, so shifting an EV charge, a laundry load or a pool pump out of those hours is the single highest-value change. Summer weekends are already cheaper — mid-peak rather than on-peak — so weekend afternoon load costs less than the same load on a Tuesday. Third, on both utilities, the plan itself: LADWP's expensive hours are weekday early afternoons and SCE's are weekday evenings, which are opposite shapes, so a household's daily rhythm can favour one structure strongly. Your utility is the authority on plan eligibility and any lock-in period.
If you want to model a change rather than read your current bill, the LADWP rate guide includes a calculator that estimates and compares an LADWP and an SCE bill from your own usage.
What this page does not tell you
Being explicit about the limits, because several of them matter:
- It is not a bill estimate. The 500 kWh comparison is arithmetic from published prices and stated assumptions. Your peak split, zone, baseline region, tier history and taxes will all move it.
- LADWP's October–December 2026 prices are not knowable yet. LADWP had not published Q4 adjustment factors as of August 12, 2026.
- CARE and FERA change the numbers and are not modelled here beyond the fixed charges. Those are discounted programs with their own eligibility rules.
- SCE's published plan prices are rounded to the cent on its rate-plan pages. Filed tariff sheets carry more decimals, and generation prices differ for community choice aggregation customers.
- The EIA-861 averages are 2024, and the EIA monthly state figures are preliminary. They are the most recent official data of their kind, but both utilities' prices have moved since.
- Nothing here is advice about your rate plan. Switching plans has eligibility rules and lock-in periods; your utility is the authority on both.
Frequently asked
What is the electricity rate in Los Angeles in 2026?
Does LADWP or SCE cost more for the same amount of electricity?
What are SCE peak hours in 2026?
How do I find out which utility serves my address in Los Angeles?
Why did my LADWP bill go up in 2026 if the rate did not change?
How do I calculate my own effective electricity rate?
Related reading
Sources & methodology
Every figure on this page is either published by the source named beside it, or calculated from published figures with the arithmetic shown. LADWP publishes both the finished R-1A and R-1B total consumption charges and the base rates and adjustment factors they are made of; this page reproduces the build-up so a reader can check the addition, and it reconciles to LADWP's published totals to five decimal places for all three tiers across all three published 2026 quarters. Averages are labelled with their population and their exclusions. Rates and program terms change — LADWP revises adjustment factors in January, April, July and October, and SCE changes rates by advice letter — and each source was verified August 12, 2026.
- LADWP — Residential rates (R-1A and R-1B base rates and total consumption charges, 2026 and 2025; Power Access Charge; minimum charge)
- LADWP — Residential electric rates (tiers by zone, seasons, TOU schedule hours, billing frequency)
- LADWP — Residential adjustment billing factors (2026 and 2025 quarterly tables)
- LADWP — Electric rates ordinance and Final incremental electric rate ordinance 4-15-16 (base energy charges; last step effective July 1, 2019)
- SCE — Time-of-use residential rate plans (weekday, weekend and winter periods; baseline credit)
- SCE — Base Services Charge (AB 205 restructure, November 2025)
- CPUC Public Advocates Office — Q2 2026 Electric Rates Report (PDF, published July 27, 2026)
- U.S. EIA — Form EIA-861 detailed data files (
Sales_Ult_Cust_2024.xlsx, utilities 11208 and 17609) - U.S. EIA — Electric Power Monthly, Table 5.6.A (May 2026 average residential price by state, preliminary)
- U.S. BLS — Average energy prices, Los Angeles-Long Beach-Anaheim (December 2024 data; includes the notice discontinuing metro-area electricity price series)
- Los Angeles Municipal Code §21.1.4 — Electricity users tax and §21.1.12 — Exemptions
- Clean Power Alliance — FAQs and SCE — Community choice aggregation
- California Energy Commission — Electric load-serving entities and SCE — Index of Communities
About this guide
This is a reference page, maintained by Cali Energy, a licensed solar, battery, EV-charger, roofing and electrical contractor in Northridge (CSLB #1032379). We have a commercial interest in electricity being expensive in Los Angeles, which is exactly why every number here is traceable to a utility tariff, a regulator or a federal dataset, and why the page carries no savings estimate. Your utility is the authority on your rate plan, your zone, your baseline allowance and your eligibility for CARE or FERA — start there, not here. Corrections and source challenges: calisolargroup@gmail.com.
Prepared by Cali Energy, August 12, 2026. This article is for general educational purposes only and is not legal, tax, financial, engineering, or utility advice. Rates, incentives, codes, permit requirements, equipment specifications, prices, and program terms may change; figures and timelines are estimates, not guarantees. Confirm current requirements with the applicable utility, AHJ, program administrator, manufacturer, or a licensed professional. See our Content Disclaimer. Cali Energy · 19201 Parthenia St Unit E, Northridge, CA 91324 · CSLB #1032379 (B, C-10, C-39)