

Solar + battery backup for a multi-day PSPS in California (2026)
A grid-tied solar system does not keep your lights on in a blackout — when the grid drops, your panels shut down with it. What carries a home through a shutoff is a battery, a backup-capable inverter and enough daily sunshine to refill the pack. The question worth answering is not whether that works but for how many days, so this page models it: your loads, your battery count, your array and the month the outage happens.
Get a free estimate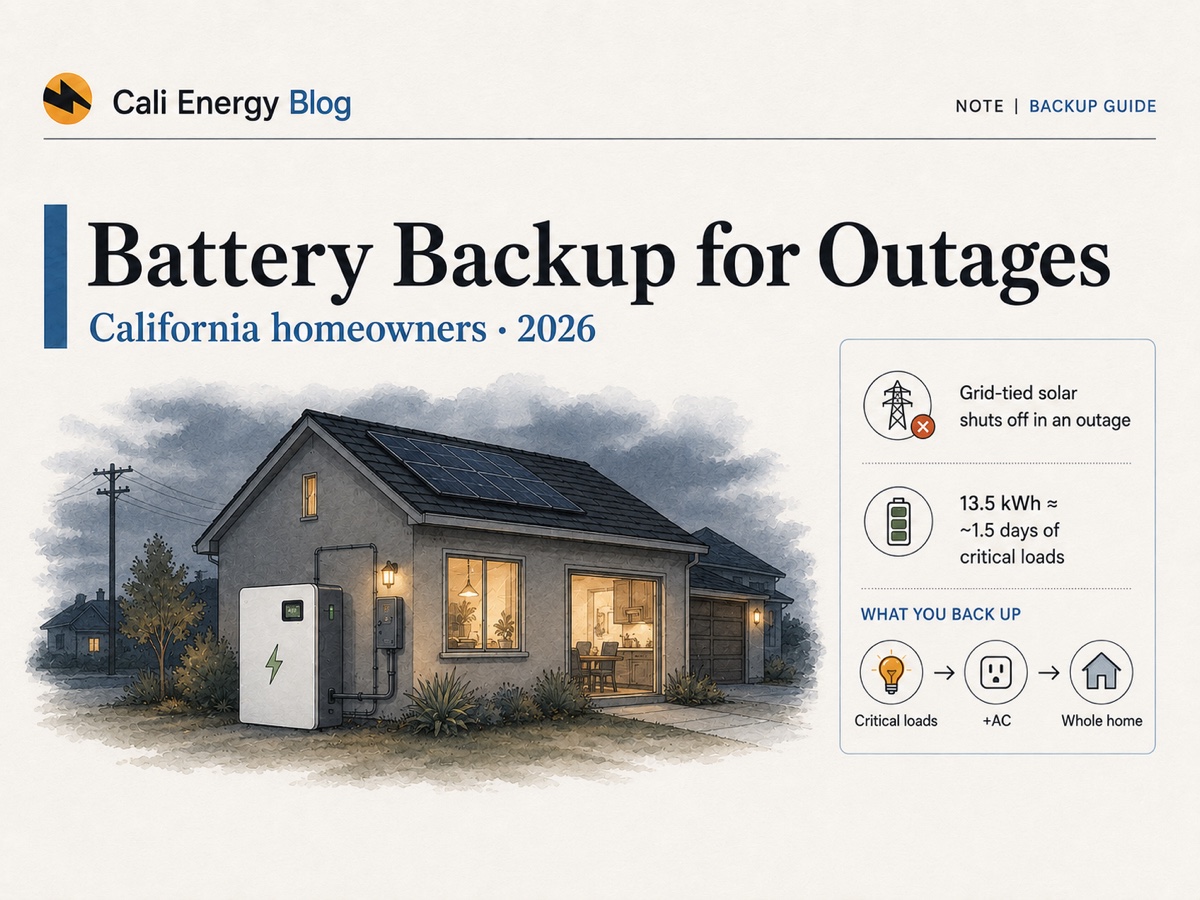
Quick answer
- A standard grid-tied system will not run your home in an outage. Grid-tied inverters must stop energizing your wiring within about 2 seconds of losing the grid (UL 1741 / IEEE 1547), so a normal solar-only home goes dark at noon on a sunny day. The one exception is a purpose-built sunlight-backup configuration, and it only covers small daytime loads — never the night.
- PSPS events are multi-day operations, not flickers. Southern California Edison ran 13 separate PSPS events in 2025; on ten of them, more than 24 hours passed between the first circuit coming back and the last.
- Without solar recharge, one ~13.5 kWh battery runs a critical-loads home for about 1.7 days (fridge, lights, WiFi, furnace fan, a medical device, a pump ≈ 7.2 kWh/day).
- Solar recharge is the biggest lever on this page. On an average December day — the weakest solar month in Los Angeles — a 2.5 kW array already produces more than a 7.2 kWh critical-loads day consumes, so the modelled battery still has charge on day 14. A run of storm or heavy-smoke days produces less than the monthly average, so treat that as a planning result, not a guarantee.
- Whole-home backup is a different animal. Add central AC, an electric water heater and EV charging and the day jumps to ~37 kWh — past what one battery can store and past what one battery can deliver at once.
How long a PSPS actually lasts
Thirteen SCE events in 2025, from the utility's own post-season filing.
Sizing arguments usually stall on a vague phrase — “outages can last hours to days.” The number that should drive your battery decision is public. Every California investor-owned utility files a PSPS post-season report with the CPUC, and SCE's 2025 filing lists each de-energization event with the time the first circuit was restored and the time the last circuit was restored.
| Event | First circuit restored | Last circuit restored | Incident-date midnight → first recorded restoration derived interval; not a customer outage duration | First → last restoration |
|---|---|---|---|---|
| PSPS Incident 01-03-2025 | Jan 5, 12:01 | Feb 6, 12:42 | 2.5 days | 32.0 days |
| PSPS Incident 01-20-2025 | Jan 20, 06:17 | Jan 27, 02:34 | 0.3 days | 6.8 days |
| PSPS Incident 06-10-2025 | Jun 11, 09:20 | Jun 22, 11:11 | 1.4 days | 11.1 days |
| PSPS Incident 06-30-2025 | Jul 1, 10:42 | Jul 11, 09:28 | 1.4 days | 9.9 days |
| PSPS Incident 07-15-2025 | Jul 15, 08:09 | Jul 15, 08:09 | 0.3 days | single restoration |
| PSPS Incident 07-20-2025 | Jul 24, 09:11 | Jul 24, 09:11 | 4.4 days | single restoration |
| PSPS Incident 08-01-2025 | Aug 2, 04:28 | Aug 8, 08:15 | 1.2 days | 6.2 days |
| PSPS Incident 08-11-2025 | Aug 11, 11:55 | Aug 24, 09:52 | 0.5 days | 12.9 days |
| PSPS Incident 09-02-2025 | Sep 2, 07:00 | Sep 10, 12:49 | 0.3 days | 8.2 days |
| PSPS Incident 10-08-2025 | Oct 12, 08:15 | Oct 14, 09:20 | 4.3 days | 2.0 days |
| PSPS Incident 10-28-2025 | Oct 28, 04:45 | Oct 29, 07:54 | 0.2 days | 1.1 days |
| PSPS Incident 11-05-2025 | Nov 5, 06:59 | Nov 6, 09:17 | 0.3 days | 1.1 days |
| PSPS Incident 11-09-2025 | Nov 10, 12:20 | Nov 10, 01:11 | 1.5 days | see note |
Source: SCE 2025 PSPS Post-Season Report (CPUC R.18-12-005), Section II, Table 1 “Aggregate Restoration Times for 2025.” The two restoration timestamps are SCE's; both elapsed columns are computed by Cali Energy. The report does not state when de-energization began, so the fourth column measures from midnight on the date in SCE's own incident name — a derived interval that brackets the wait, not a de-energization duration. For the 11-09 incident the report lists the last restoration (01:11) earlier in the day than the first (12:20), which cannot be read as a window, so we leave it blank rather than guess.
Two things the table does not tell you: how many customers each event touched, and whether your own address sits on a high fire-risk circuit. Both are in what triggers a PSPS shutoff.
How many days would your system actually last?
Pick your loads, your battery count, your array size and the month. The model runs day by day, with solar recharging the battery each morning.
Method: the battery starts full; each day solar first serves daytime load (assumed 45% of the day's use), the surplus charges the battery, and the evening and night run on stored energy. A 10% reserve is held back rather than draining the pack flat. Solar figures are the monthly daily average for a south-facing 20° Los Angeles roof from PVGIS (1,676 kWh/kW·year), so a run of storm days will come in below this and a clear Santa Ana week above it. Planning estimate, not a quote or a guarantee.
Typical household loads — watts and daily energy
The reference values behind the model above.
| Load | Running watts | Est. kWh/day | Backup group |
|---|---|---|---|
| Refrigerator / freezer | 150 | 1.5 | Critical |
| Essential LED lighting | 100 | 0.8 | Critical |
| WiFi, router, phones, laptop | 60 | 0.6 | Critical |
| Furnace / heater blower fan | 500 | 1.8 | Critical |
| Medical device (CPAP, oxygen) | 60 | 0.5 | Critical |
| Well / sump pump | 900 | 2.0 | Critical |
| TV & entertainment | 150 | 1.0 | Comfort |
| Microwave & small kitchen appliances | 1,000 | 1.0 | Comfort |
| Central air conditioning (summer) | 3,500 | 10 | Whole-home |
| Electric water heater | 4,000 | 8 | Whole-home |
| EV charging (Level 2) | 7,000 | 10 | Whole-home |
Sources: wattage and usage ranges adapted from EIA Residential Energy Consumption Survey. Central AC and EV figures vary widely by unit and climate.
The six critical rows add up to 7.2 kWh/day. That is the number behind “one battery, about a day and a half” — 12.15 usable kWh after the 10% reserve, divided by 7.2, is 1.7 days with no sun at all. Everything above that comes from the roof.
kWh decides how long — kW decides whether it runs at all
A battery has two separate ratings. Usable capacity (kWh) sets how many hours you get. Continuous power (kW) sets how much can run at the same instant — a Tesla Powerwall 3, for example, is rated 13.5 kWh usable and 11.5 kW continuous at 240 V. Tick every load in the model above and the running total is 17.4 kW, before any motor's startup surge. The energy math might say two days; the power math says the system trips or sheds load the first time the AC, the water heater and the EV charger overlap.
This is why whole-home backup usually means more than one battery — or a smart panel that sheds the big loads automatically. Which path fits your house is the subject of whole-home vs critical-loads backup, and the model above flags the overload rather than resolving it.
Why the month of the outage changes the answer
The same array recharges very differently in January and August.
A battery is only self-sustaining if the roof puts back what the house takes out. In Los Angeles that number swings by about 75% across the year, and — as SCE's 2025 table shows — shutoffs happen at both ends of that swing.
| Month | kWh/day per kW | 6 kW array makes | Smallest array still holding charge on day 14 at 7.2 kWh/day average-month production |
|---|---|---|---|
| January | 3.39 | 20.3 | 2.0 kW |
| February | 3.93 | 23.6 | 2.0 kW |
| March | 4.66 | 28.0 | 1.5 kW |
| April | 5.25 | 31.5 | 1.5 kW |
| May | 5.36 | 32.1 | 1.5 kW |
| June | 5.38 | 32.3 | 1.5 kW |
| July | 5.48 | 32.9 | 1.5 kW |
| August — peak month | 5.55 | 33.3 | 1.5 kW |
| September | 4.87 | 29.2 | 1.5 kW |
| October | 4.25 | 25.5 | 2.0 kW |
| November | 3.77 | 22.6 | 2.0 kW |
| December — worst month | 3.18 | 19.1 | 2.5 kW |
Production source: PVGIS (European Commission JRC), PVcalc for 34.05°N, −118.24°W, 1 kWp crystalline silicon, 20° fixed tilt, south-facing, 14% system losses — 1,676 kWh/kW per year; monthly totals divided by days in the month. Consistent with the ~1,700 kWh/kW we publish in Los Angeles sun hours. The last column is the smallest 0.5 kW step at which the day-by-day model above still has charge left on day 14, with one 13.5 kWh battery.
The practical reading is that two conditions have to hold at once, and the second one is the one people miss. The array has to cover the day's energy, and the battery has to be big enough to carry the night on its own. For critical loads both are easy: 1.5–2.5 kW of panels covers an average day in any month, and the night portion is under 4 kWh, well inside one battery. For whole-home loads the second condition bites hard. A 37 kWh day puts roughly 20 kWh into the dark hours — more than one 13.5 kWh battery holds — so in our model one battery runs out on the first night in August whether the array is 7 kW or 16 kW, while two batteries with a 7 kW array still have charge on day 14. More panels cannot fix a bank that cannot survive until sunrise.
Three honest caveats. These are monthly averages that include cloudy days, so any single outage can land well below them — a winter storm, a stretch of marine layer, or heavy wildfire smoke all cut output, and nothing in this model says the sun will cooperate on the days your grid is down. In the other direction, a Santa Ana wind event — the classic PSPS trigger — usually arrives with clear skies, so production during those particular outages tends to run above the table. And in island mode a hybrid system throttles the array once the battery is full and the house is satisfied, so surplus beyond that is not banked anywhere.
What has to be in place before any of this works
Four components — panels alone are not one of them.
1. A battery
Stored energy runs the house when the grid is down and the sun is not up. The number that matters is usable kWh; a common single unit is about 13.5 kWh.
2. A hybrid / backup-capable inverter
A plain string inverter cannot form its own grid. You need an inverter that can island — create a stable 240 V supply for the house with the utility gone.
3. A microgrid interconnect / backup gateway
An automatic transfer device that physically separates your home from the utility during an outage, so your battery powers only your house — never the lines outside.
4. A defined backup configuration
Critical-loads backup feeds a small subpanel. Whole-home backup runs everything, needs more storage and more power, and is a different quote.
The reason the first three exist is the same safety rule: every grid-tied inverter sold in the U.S. must include anti-islanding protection under UL 1741 and IEEE 1547, and stop energizing your wiring within about two seconds of losing the grid, so it cannot electrocute a lineworker repairing a “dead” line. Without a gateway and a backup-capable inverter, that rule takes your panels offline with everything else. The mechanism is covered in do solar panels work in a power outage.
Sunlight backup: daytime-only power with no battery
There is a configuration that keeps limited power on without any storage. Enphase's Sunlight Backup uses IQ8 microinverters, which can form their own grid, plus at least one IQ Load Controller to hold the island stable. Enphase is explicit about the limits: it is for essential, low-load appliances during daytime outages, and it needs sun to work — when production drops or evening comes, the island collapses.
So it is worth knowing about, and it is not what this page models. Everything below assumes a battery, because a PSPS that runs past sunset is exactly the case sunlight backup cannot cover.
Budget reality in 2026
Short version, because we keep the full pricing breakdown on one page.
As approximate 2026 California ranges before incentives: one ~13.5 kWh battery with a hybrid inverter runs $13,000–$18,000 installed, a backup gateway adds $2,000–$3,500, a critical-loads subpanel $1,000–$2,500, and whole-home backup with two or more batteries and a possible panel upgrade adds $10,000 and up. Per-kWh pricing, what moves it, and retrofit-versus-new-solar differences are in how much a home battery costs in California.
A battery optimised for your bill can be empty when the outage starts
Under NEM 3.0 the profitable habit is to discharge the pack into the evening peak, which is exactly when a wind-driven shutoff tends to begin. If resilience is the point, ask your installer to set a backup reserve — a floor the battery will not discharge below for bill savings. Most systems expose it as a percentage in the app.
LADWP, Burbank and Glendale customers are on municipal utilities, are not on NEM 3.0, and do not have a formal PSPS program in the way SCE, PG&E and SDG&E do — but the outage physics and the reserve setting are identical. Rate-plan mechanics are in NEM 3.0 explained.
How to check your own numbers
Four steps, using documents you already have.
- Get your real daily kWh. Take the kWh from your last bill and divide by the days in the billing period — LADWP bills most residential customers every two months, so use the period on the statement, not 30. That is your whole-house day; backup only needs the part you would keep running.
- List the loads you would not switch off. Medical equipment, refrigeration, a well pump, heat in winter. Everything else is negotiable at hour 40 of an outage.
- Read the two ratings off the battery datasheet — usable kWh and continuous kW — and check both against the model above, not just the first one.
- Ask the installer for the island-mode behaviour in writing: what is on the backup panel, what the backup reserve is set to, and whether the array can recharge the battery with the grid down. Not every retrofit can.
One of our own systems, run through the model above
A real SCE project with a public interconnection record — and what the model says it would do in an outage.
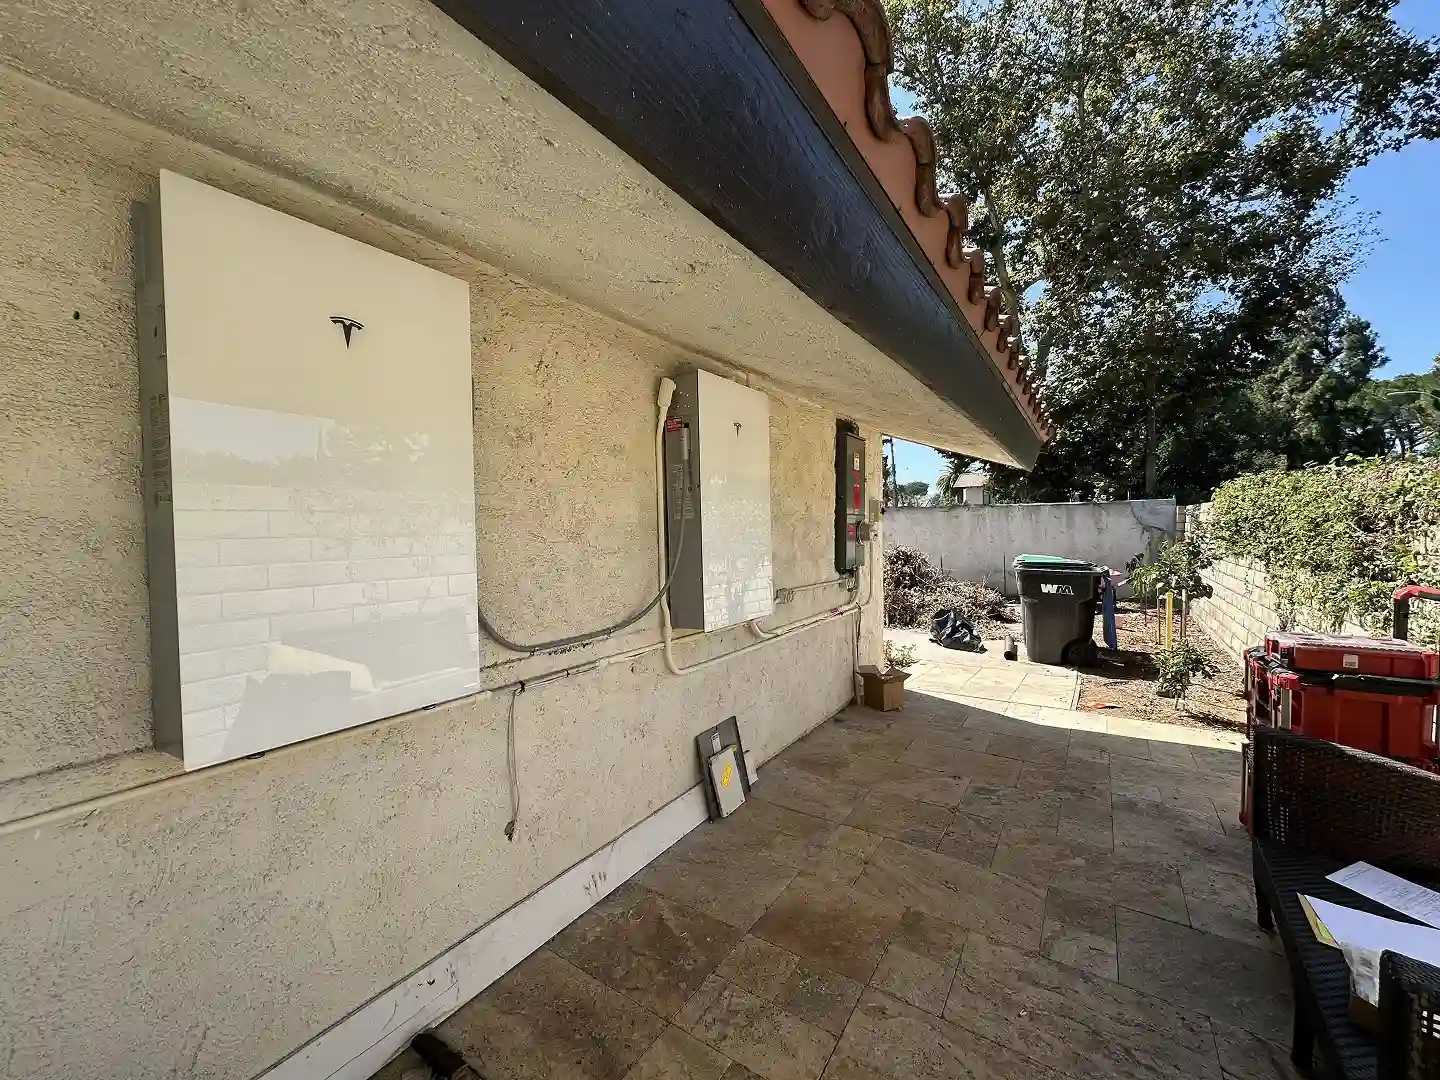
Everything above is a model. This is a system we designed, permitted and energized, with the numbers that matter for backup. It is a useful test case because its specification lands exactly on two of the model's inputs: 27 kWh of usable storage (two units' worth) and a 10.12 kW array.
| Field | Value | Where it comes from |
|---|---|---|
| Array | 10.12 kW DC / 9.412 kW AC — 22 × REC 460 W | Public dataset + our own project record |
| Storage | 27 kWh usable — Tesla Powerwall 3 with Expansion Pack | Public dataset |
| Continuous power | 11.5 kW | Public dataset |
| Backup type | Whole-home, via Tesla Backup Switch | Our project record |
| Service panel | 225 A, newly rebuilt | Our project record |
| Utility / tariff | SCE / Net Billing Tariff (NEM 3.0) | Public dataset |
| Interconnection | Application received Oct 3, 2025 → approved Dec 1, 2025 (59 days); status Interconnected | Public dataset |
| Installer of record | CSLB #1032379 | Public dataset |
Interconnection fields come from SCE's Interconnected Project Sites dataset (Jan 2020 – Mar 2026 release), published through California Distributed Generation Statistics and filtered here to CSLB #1032379 — a record neither we nor the homeowner control. The full build — the four SCE corrections, the 100-foot conduit run, the true-up that landed at $15 — is written up in the Westlake Village case study.
Now put its own numbers into the model above — two batteries, a 10 kW array — and ask what it survives:
| Scenario | Load | August | October | January | December |
|---|---|---|---|---|---|
| Critical loads only | 7.2 kWh/day | 14+ days | 14+ days | 14+ days | 14+ days |
| Whole-home, everything on | 37.2 kWh/day | 14+ days | 14+ days | 2.9 days | 2.0 days |
Produced by entering 2 batteries and a 10 kW array into the tool on this page. “14+ days” means the model still had charge at the end of its 14-day horizon on average-month production.
One honest mismatch between this project and the model: the tool treats each battery as adding both capacity and power, but a Powerwall 3 Expansion Pack adds capacity only. This home has 27 kWh of storage behind a single 11.5 kW inverter, not 23 kW. If you are checking a real proposal, read the two ratings separately from the datasheet — that is exactly the trap the power warning above is built to catch.
A larger example on the same principle: an Altadena home in a Tier 3 fire-threat area, where we paired 26.7 kW of solar with more than 38 kWh of storage. Its owner learned about the next SCE shutoff from a neighbour the following morning.
What this page does not tell you
It does not predict whether your address will be de-energized — that depends on your circuit and the fire-threat map. It does not price a specific proposal, rank battery brands, or model your bill savings. The day-by-day figures assume a healthy battery, a shade-free south-facing array and average weather for the month; a storm week, heavy shading, an ageing pack or a system that cannot recharge in island mode will all come in lower. And the SCE table describes SCE's 2025 season, not a forecast of 2026.
Frequently asked
Will my grid-tied solar power my house during a blackout or PSPS?
How many days will one home battery last in an outage?
How long do PSPS shutoffs actually last?
Does the month of the outage really change how big a battery I need?
Why does the calculator warn me about kW when I have enough kWh?
Can I still get an incentive for a battery in 2026?
Related reading
Sources & methodology
Figures on this page come from the primary sources below and, where noted, from Cali Energy calculations using the stated assumptions. Rates, incentives, and program terms change; each was verified September 4, 2026.
- SCE — 2025 PSPS Post-Season Report (CPUC R.18-12-005), Table 1: Aggregate Restoration Times for 2025
- CPUC — Utility PSPS reports (post-event and post-season)
- PVGIS (European Commission JRC) — PV performance tool, Los Angeles monthly output
- EIA Residential Energy Consumption Survey
- California Distributed Generation Statistics — SCE Interconnected Project Sites dataset (Jan 2020 – Mar 2026)
- Enphase — IQ8 Sunlight Backup (daytime, battery-free backup: scope and requirements)
- Tesla — Powerwall 3 datasheet (13.5 kWh usable, 11.5 kW continuous at 240 V)
- IEEE 1547 — Standard for Interconnection and Interoperability of Distributed Energy Resources
- UL 1741 — Inverters, Converters, Controllers for Distributed Energy Resources
- IRS — Residential Clean Energy Credit
- SelfGenCA — SGIP Program Metrics
- CPUC — Net Billing Tariff (NEM 3.0)
Find out how many days your house would actually get
Cali Energy designs backup around the loads you refuse to lose — and sizes the battery against both limits, kWh and kW, using your real usage rather than a preset. In-house crews across LADWP, SCE and the Burbank/Glendale municipals. Call +1 (323) 844-7777 for a straight assessment.
Get a free estimatePrepared by Cali Energy, September 4, 2026. This article is for general educational purposes only and is not legal, tax, financial, engineering, or utility advice. Rates, incentives, codes, permit requirements, equipment specifications, prices, and program terms may change; figures and timelines are estimates, not guarantees. Confirm current requirements with the applicable utility, AHJ, program administrator, manufacturer, or a licensed professional. See our Content Disclaimer. Cali Energy · 19201 Parthenia St, Unit E, Northridge, CA 91324 · CSLB #1032379 (B, C-10, C-39)