

Average electric bill in California: what the data actually shows
The average California home paid about $161 a month for electricity in 2024 — the latest full year of EIA utility data — for about 503 kWh, or 16.5 kWh a day. But averages hide a wide spread: utility-reported bills for June 2026 run from $69 (a CARE household in PG&E’s cool climate zone) to $254 (a non-CARE household in SCE’s hot zone 15). The statewide price was 33.61¢/kWh in July 2026, second highest of 51 U.S. jurisdictions.
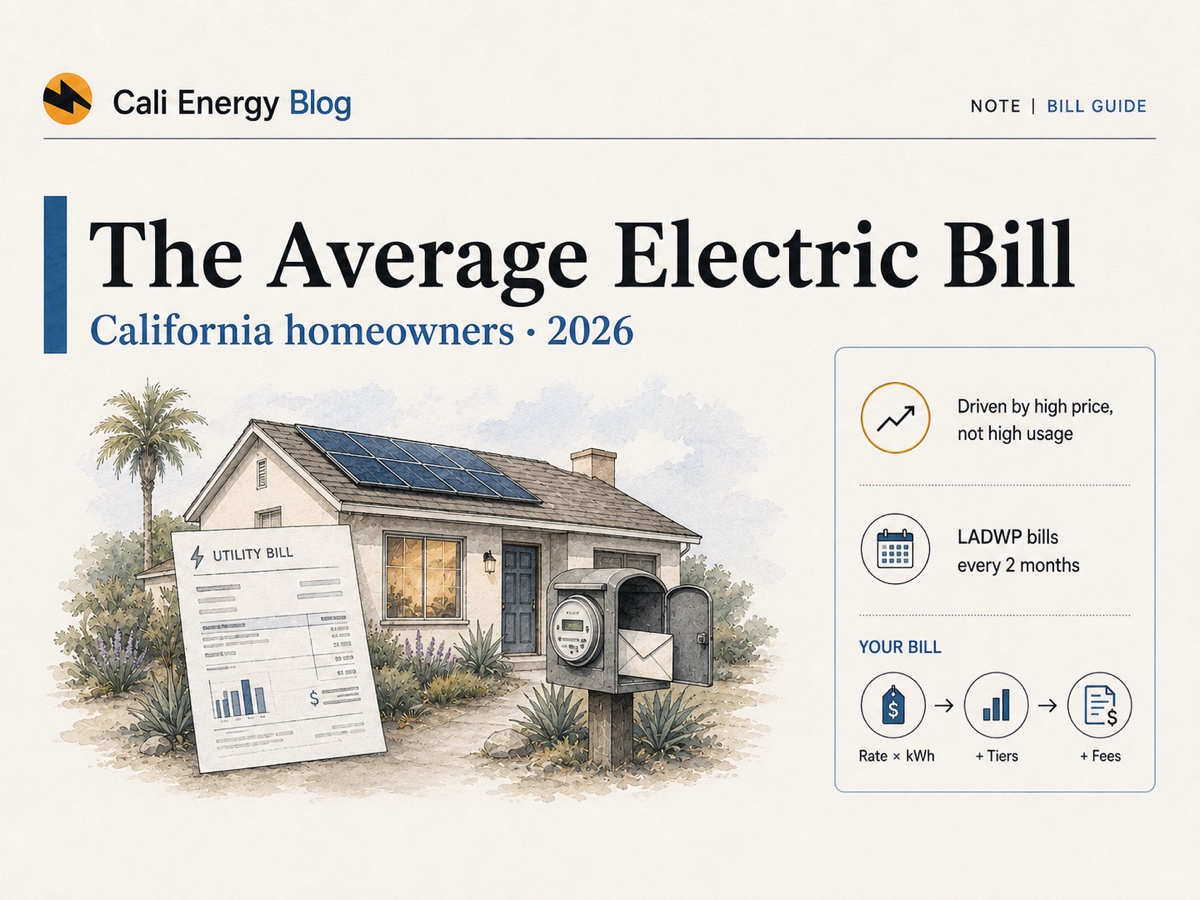
Quick answer
- The average California home paid about $161 a month for electricity in 2024, the latest full year of utility data from the U.S. Energy Information Administration, using about 503 kWh a month — 16.5 kWh a day.
- The price is 33.61¢ per kWh (July 2026, the latest month EIA has published) — about 1.8× the U.S. average of 18.31¢ and second of 51 U.S. jurisdictions. Only Hawaii is higher.
- Real bills spread widely. Utility-reported averages for June 2026 range from $69 to $254 a month depending on utility, climate zone and CARE status.
- Californians use far less electricity than most Americans — 42% less than the U.S. average home — and still pay about 13% more a month.
- Your utility matters. In 2024 an LADWP household averaged $116 a month; an SCE household on full SCE service, $164; PG&E, $198.
The average bill, as EIA counts it — and by utility
Revenue divided by customers: a true average of real bills, for the whole state and for each utility.
| Utility | Average bill a month | kWh a month | kWh a day | ¢/kWh |
|---|---|---|---|---|
| California (all customers) | $160.86 | 503 | 16.5 | 31.97 |
| SCE (bundled customers) | $164.02 | 506 | 16.6 | 32.43 |
| PG&E (bundled) | $198.05 | 500 | 16.4 | 39.62 |
| SDG&E (bundled) | $159.10 | 365 | 12.0 | 43.63 |
| LADWP | $115.63 | 485 | 15.9 | 23.84 |
| Glendale Water & Power | $139.11 | 411 | 13.5 | 33.81 |
| Pasadena Water and Power | $123.59 | 476 | 15.6 | 25.98 |
| Burbank Water and Power | $89.90 | 467 | 15.4 | 19.25 |
| United States | $142.26 | 863 | 28.4 | 16.48 |
Source: EIA-861 annual utility data, 2024 (final), residential sales, revenue and customers · Cali Energy calculation. Statewide and U.S. rows include every customer and supplier; utility rows use full-service (“bundled”) customers, so SCE, PG&E and SDG&E households that buy generation from a community choice supplier such as Clean Power Alliance are not in them. CARE households are included at their discounted bills. Daily figures are monthly × 12 ÷ 365.
This is the number most “average bill” pages are reaching for, and it comes with two cautions. It is 2024: SCE estimated a 12.9% rise in typical bills on October 1, 2025 and has moved rates several times since, so a 2026 SCE bill at the same use is higher (SCE puts its typical 500 kWh bill at $188.64 from October 1, 2026, SCE rate advisory). And it blends apartments with large houses, so it describes no particular home. Across all customers in each territory, daily use averaged 16.3 kWh at SCE, 15.9 at LADWP, 14.1 at PG&E and 9.7 at SDG&E.
What Californians actually pay per kWh
The price is the part that is officially published and independently checkable every month.
The U.S. Energy Information Administration publishes an average residential price for every state each month. For July 2026, the most recent month available, California’s residential price was 33.61¢ per kWh, against a U.S. average of 18.31¢.
We cross-checked that figure against EIA’s own underlying data rather than taking it at face value. In the same month California’s residential sector bought 8,480 thousand megawatt-hours and paid $2,850 million for it. Dividing one by the other gives 33.61¢ per kWh — the published price, reproduced from the raw sales and revenue tables.
Sources: EIA Electric Power Monthly, Table 5.6.A (average price), Table 5.4.A (sales) and Table 5.5.A (revenue), July 2026 data released September 24, 2026. Verified October 6, 2026.
Real average bills: by utility, climate zone and income status
Estimated bills the utilities themselves report to the state’s ratepayer advocate.
The utilities report estimated average bills to the CPUC’s Public Advocates Office quarterly, broken out by a sample hot and cool climate zone in each service territory and by whether the household receives the CARE low-income discount. These are the figures as of June 1, 2026, the latest published.
| Utility | Climate zone | Non-CARE | CARE |
|---|---|---|---|
| PG&E | Hot — CZ “P” | $168 | $125 |
| PG&E | Cool — CZ “T” | $124 | $69 |
| SCE | Hot — CZ 15 | $254 | $165 |
| SCE | Cool — CZ 6 | $152 | $81 |
| SDG&E | Hot — Desert | $130 | $126 |
| SDG&E | Cool — Coastal | $156 | $87 |
Source: Public Advocates Office at the CPUC, Q2 2026 Electric Rates Report (July 2026), slides 13–15. Values are the June-2026 data labels printed on the report’s charts. Each utility’s zones are a sample of hot and cool zones from its territory, not a territory-wide average. LADWP is municipal and is not in this dataset.
Three things fall out of this table that a single statewide number cannot show.
1. The spread within California is 3.7×. A Non-CARE household in SCE’s hot zone 15 averages $254 a month. A CARE household in PG&E’s cool zone averages $69. Both are California; both are “average.”
2. Climate beats utility. Within SCE alone, hot zone 15 versus cool zone 6 is $254 against $152 for the same customer class. The report notes why: zone 15 households average around 700 kWh a month, zone 6 around 385 kWh. Nearly all of that gap is air conditioning, not rates.
3. SDG&E runs backwards. Its coastal Non-CARE customers average $156 — more than its desert customers at $130. The report attributes this to coastal customers using more electricity in winter. Any page that assumes hotter always means higher has this one wrong.
If you want one number to compare yourself against, use the row that matches your utility, your climate and your income status — not the statewide average.
How California ranks against every other state
Second of 51 — and Maine is now only 1.2¢ behind.
| Rank | State or district | Residential price (¢/kWh) |
|---|---|---|
| 1 | Hawaii | 48.00 |
| 2 | California | 33.61 |
| 3 | Maine | 32.41 |
| 4 | Massachusetts | 30.49 |
| 5 | New York | 29.90 |
| 6 | Alaska | 28.83 |
| 7 | Rhode Island | 28.29 |
| 8 | New Hampshire | 26.60 |
| 9 | District of Columbia | 25.21 |
| 10 | New Jersey | 25.19 |
Ranking computed by Cali Energy across all 51 jurisdictions in EIA Table 5.6.A, July 2026. Hawaii is a genuine outlier: it burns imported oil for most of its generation.
California rose more slowly than the country
Between July 2025 and July 2026 the California residential price went from 32.66¢ to 33.61¢, up 2.9%. Over the same twelve months the U.S. average rose from 17.45¢ to 18.31¢, up 4.9%, and Maine jumped from 27.98¢ to 32.41¢.
The practical reading: California remains extremely expensive in absolute terms, but the rest of the country is closing part of the gap rather than California pulling further ahead. California’s prices move in steps when rate changes are approved, so treat any single month as a dated observation, not a forecast — our rate filings tracker shows what the utilities have asked for next.
Both years read from the same EIA Table 5.6.A, which prints July 2026 beside July 2025. Percentage changes calculated by Cali Energy.
Why every website gives you a different “average bill”
Published figures for the same state range from roughly $135 to $260 a month. They are answering different questions.
| Method | What it produces | What it hides |
|---|---|---|
| Statewide rate × an assumed usage | 33.61¢ × 500 kWh = $168 | Simple and reproducible, but the answer moves entirely with the usage you assume. |
| Utility-specific rate × usage | varies by territory | More realistic for one household, but no longer a statewide figure. |
| Utility revenue ÷ number of customers | $161 a month (EIA, 2024) | A true average of real bills — but a year old, and it blends apartments with large homes. |
Before you compare two published averages, check which of these three they used. A page quoting a low figure and a page quoting a high one can both be arithmetically correct on the same data. This page uses all three for what each is good at: EIA’s $161 as the statewide average, the utility-reported bills as the realistic range, and the monthly price for your own arithmetic.
Work out your own bill
One multiplication, using the published statewide price.
Monthly energy cost = your monthly kWh × your price per kWh. At California’s July 2026 statewide residential price of 33.61¢:
| Monthly usage | Energy cost |
|---|---|
| 300 kWh | $100.83 |
| 500 kWh | $168.05 |
| 700 kWh | $235.27 |
| 1,000 kWh | $336.10 |
| 1,500 kWh | $504.15 |
Two things this deliberately leaves out, because they are specific to your account and cannot be averaged honestly: fixed charges (a daily service charge applies on most plans regardless of usage) and taxes and local surcharges. Your actual statement will sit above these figures for that reason.
It also uses a single statewide price. Your own rate depends on your utility, your rate plan, the season, and — on time-of-use plans — when in the day you use electricity. For an SCE household that last factor can matter more than the total: see our comparison of SCE time-of-use plans and, for the block of usage priced most favorably, our SCE baseline region lookup.
How many Californians cannot pay the bill
The most under-reported number on this subject, and the one that says most about affordability.
The CPUC’s independent ratepayer advocate reports that more than one in five households served by California’s three large investor-owned utilities are behind on their energy bills — 2,424,244 customers, or 20.6%, owing an average of $619.
| Utility | Customers in arrears | Share of customers | Average amount owed |
|---|---|---|---|
| PG&E | 1,356,481 | 24% | $572 |
| SCE | 813,943 | 17% | $733 |
| SDG&E | 253,820 | 18% | $501 |
| Combined | 2,424,244 | 20.6% | $619 |
Source: Public Advocates Office at the CPUC, Q2 2026 Electric Rates Report (July 2026), from May 2026 utility compliance filings in CPUC proceeding R.18-07-005. Note per the source: PG&E figures include both electric and natural gas customers. LADWP is a municipal utility and is not covered by this CPUC dataset.
SCE’s own monthly report to the CPUC shows the count easing but not the balance: 764,586 SCE residential customers were in arrears in July 2026, owing $640.9 million, 39% of it more than 180 days old (SCE disconnect data report, July 2026). Help with a past-due bill is covered in can’t pay your electric bill.
This reframes the question. “Average bill” suggests a typical household comfortably paying a typical amount. For roughly a fifth of these customers, the bill is not being paid in full at all.
How much rates have actually risen — and what is driving it
Ten years of change, by utility, from the regulator’s own tracking rather than a press release.
| Utility | 10-year change |
|---|---|
| SCE | +101% |
| SDG&E | +97% |
| PG&E | +69% |
Source: Public Advocates Office at the CPUC, Q2 2026 Electric Rates Report, from Investor-Owned Utility Advice Letters (California residential average rates). Verified October 6, 2026.
The Public Advocates Office names three primary statewide drivers, citing the CPUC’s SB 695 report:
- Wildfire mitigation and wildfire liability costs
- Transmission and distribution investments
- Rooftop solar incentives (“net energy metering”)
We install solar for a living, and we are publishing the regulator’s third item unedited. Cost-shift from net energy metering is contested — solar advocates dispute both its size and its framing — but it appears on the CPUC’s own list, and leaving it out to make this page more comfortable would make it less accurate. It is also part of why NEM 3.0 replaced NEM 2.0.
If your income qualifies, the discount is large
Two statewide programs cut the bill substantially, and the table above shows what they are worth in practice.
- CARE — a 30–35% discount on the electric rate. With exemptions from certain costs and the Base Services Charge treatment, the Public Advocates Office states CARE customers see total discounts of approximately 40%. Eligibility: household income at or below 200% of the federal poverty guidelines, or enrollment in a qualifying program such as CalFresh, Medi-Cal, SSI or WIC.
- FERA — an 18% discount on electricity for households between 200% and 250% of the federal poverty guidelines. Offered by SCE, SDG&E and PG&E only.
What it is actually worth — taken from the reported bills above rather than from a percentage applied to a statewide average:
- SCE, hot zone 15: $254 → $165 — about $89 a month, roughly $1,070 a year.
- SCE, cool zone 6: $152 → $81 — about $71 a month.
- PG&E, cool zone: $124 → $69 — about $55 a month.
- SDG&E, desert: $130 → $126 — only about $4, which shows the discount is not uniform and depends on the underlying usage and rate mix.
These are differences between reported average bills for the two customer groups in the same zone, so they reflect both the discount and any usage differences between those groups. They are not a quoted discount for your own account.
| Household size | CARE — income at or below | FERA — income range |
|---|---|---|
| 1–2 | $43,280 | $43,281 – $54,100 |
| 3 | $54,640 | $54,641 – $68,300 |
| 4 | $66,000 | $66,001 – $82,500 |
| 5 | $77,360 | $77,361 – $96,700 |
| 6 | $88,720 | $88,721 – $110,900 |
Sources: CPUC — CARE/FERA Program and SCE — CARE & FERA discounted rates. Verified October 6, 2026. Above six people, CARE limits continue at $11,360 per additional person.
What this page cannot determine
- Your actual bill. It depends on your utility, rate plan, baseline allocation, season, time-of-day usage, fixed charges and local taxes. Your statement is the authority.
- A single statewide average bill. No such figure exists that is both honest and useful — see the three methods above.
- Whether your bill is “too high.” That is a usage question, not a price question. Our California usage comparison answers it directly.
- Next month’s price. EIA publishes history, not forecasts, and California rates change through regulatory decisions.
How much solar changes the arithmetic
Solar reduces the kilowatt-hours you buy; it does not remove the fixed charges, taxes and non-bypassable charges that survive regardless of production. That residual is why a well-sized system produces a small bill rather than no bill.
Two rules decide how much it helps. First, which utility bills you: under California’s Net Billing Tariff, exported energy is worth less than the energy you avoid buying, so self-consumption matters more than raw production — see how the NEM 3.0 export rate is set. LADWP customers are on a different basis entirely. Second, the federal credit has changed: per the IRS, the Residential Clean Energy Credit is not available for property placed in service after December 31, 2025, so any page still quoting a 30% federal credit for a new system is out of date.
Federal credit status: IRS — Residential Clean Energy Credit. Verified October 6, 2026.
Frequently asked
What is the average electric bill in California?
About $161 a month in 2024, the latest full year of EIA utility data, for about 503 kWh. Bills vary widely around that: utility-reported averages for June 2026 range from $69 (a CARE household in PG&E’s cool zone) to $254 (a non-CARE household in SCE’s hot zone 15). By utility, EIA’s 2024 averages were $116 at LADWP, $164 at SCE and $198 at PG&E for full-service customers.
How much is electricity per kWh in California right now?
33.61¢ per kWh for residential customers in July 2026, the most recent month published by the U.S. Energy Information Administration. We reproduced it from EIA’s own sales and revenue tables ($2,850 million ÷ 8,480 thousand MWh = 33.61¢). Source: EIA Table 5.6.A.
How many kWh does a California home use per day?
About 16.5 kWh a day — 503 kWh a month — on EIA’s 2024 figures, against about 28 kWh a day for the average U.S. home. By territory it was 16.3 kWh at SCE, 15.9 at LADWP, 14.1 at PG&E and 9.7 at SDG&E. To judge your own use, see whether your electricity use is high for California.
Does California have the highest electricity prices in the country?
No — it is second of 51 U.S. jurisdictions. Hawaii is higher at 48.00¢ per kWh, because it generates most of its power from imported oil. California’s 33.61¢ is now closely followed by Maine at 32.41¢ (EIA, July 2026).
Are California electricity prices still rising?
Slowly. California’s residential price was 33.61¢ in July 2026 against 32.66¢ in July 2025 — up 2.9% — while the U.S. average rose 4.9%. California rates move in steps when rate changes are approved, so a single month is not a trend.
Why is my California electric bill so high?
Price, more than usage. California’s residential price is about 1.8× the U.S. average, driven mainly by wildfire-mitigation and grid costs recovered through rates, a high delivery share, and time-of-use pricing that makes late-afternoon and evening electricity expensive. Household size alone is a poor predictor.
Which California utility is cheapest?
Rates differ substantially between territories, and municipal utilities such as LADWP are priced separately from the investor-owned utilities. This page reports the statewide EIA figure rather than ranking utilities, because a fair ranking requires matching rate plan, season, usage tier and time-of-day profile — not a single headline rate. Compare your own plan directly on your utility’s published schedule.
Does solar eliminate a California electric bill?
It reduces it rather than removing it. Fixed charges, taxes and non-bypassable charges apply regardless of how much your system produces. How much of the rest is offset depends on your utility and how much of your own generation you consume on site rather than export.
How many Californians are behind on their electric bills?
2,424,244 customers — 20.6%, or more than one in five — were in arrears across PG&E, SCE and SDG&E as of May 2026, owing an average of $619. Source: CPUC Public Advocates Office, Q2 2026 Electric Rates Report. PG&E’s figure includes gas customers; LADWP is not in this dataset.
How much have California electricity rates risen in 10 years?
Between January 2016 and June 2026, residential average rates rose 101% at SCE, 97% at SDG&E and 69% at PG&E, per the CPUC Public Advocates Office. It names three primary drivers: wildfire mitigation and liability costs, transmission and distribution investment, and rooftop solar incentives.
Can I get a discount on my California electric bill?
Yes, if your income qualifies. CARE gives a 30–35% discount (32.5% at SCE) for households at or below 200% of the federal poverty guidelines. FERA gives 18% for households between 200% and 250%. For a 500 kWh household, CARE is worth roughly $55 a month. These are CPUC programs and do not cover municipal utilities such as LADWP.
Why is my bill so different from my friend's in another part of California?
Climate zone usually matters more than the utility. Within SCE alone, the hot zone 15 average is $254 against $152 in cool zone 6 for the same customer class — because zone 15 households average around 700 kWh a month and zone 6 around 385 kWh. Income status matters too: CARE households pay substantially less in every zone.
Related reading
Sources & methodology
Figures on this page come from the primary sources below and, where noted, from Cali Energy calculations using the stated assumptions. Rates, incentives, and program terms change; each was verified October 6, 2026.
- EIA — Electric Power Monthly, Table 5.6.A (average price by state, July 2026)
- EIA — Table 5.4.A (retail sales by state, July 2026)
- EIA — Table 5.5.A (revenue by state, July 2026)
- SCE — Rate advisory (typical 500 kWh bill from October 1, 2026)
- SCE — Monthly Disconnect Data Report, July 2026 (filed August 20, 2026)
- EIA — Form EIA-861 annual electric utility data, 2024 (residential sales, revenue, customers)
- EIA — Electric Power Monthly (publication home)
- IRS — Residential Clean Energy Credit
- LADWP — residential electric rates
- SCE — time-of-use residential rate plans
- CPUC Public Advocates Office — Q2 2026 Electric Rates Report (PDF)
- CPUC — CARE/FERA Program
- SCE — CARE & FERA discounted rates
About this reference
Cali Energy is a licensed California contractor (CSLB #1032379) in Northridge. We publish this page as a reference and date it to the day each figure was checked against its source. Prices are read from the U.S. Energy Information Administration; rankings and percentage changes are our calculations from that same published table.
Prepared by Cali Energy, October 6, 2026. This article is for general educational purposes only and is not legal, tax, financial, engineering, or utility advice. Rates, incentives, codes, permit requirements, equipment specifications, prices, and program terms may change; figures and timelines are estimates, not guarantees. Confirm current requirements with the applicable utility, AHJ, program administrator, manufacturer, or a licensed professional. See our Content Disclaimer. Cali Energy · 19201 Parthenia St, Unit E, Northridge, CA 91324 · CSLB #1032379 (B, C-10, C-39)