

The Duck Curve: Why California Wastes Solar
Here is the paradox in the data: California keeps adding solar, and keeps throwing more of it away. The state’s grid operator, CAISO, curtailed about 3.42 million MWh of solar and wind in 2024 and about 3.77 million in 2025 — and 4.95 million in just January through August 2026, about 51% more than the same months of 2025. Most of it is spring solar the grid cannot move or use at midday. That is the duck curve, and it is why midday exports earn little and batteries earn more.
Get a free estimate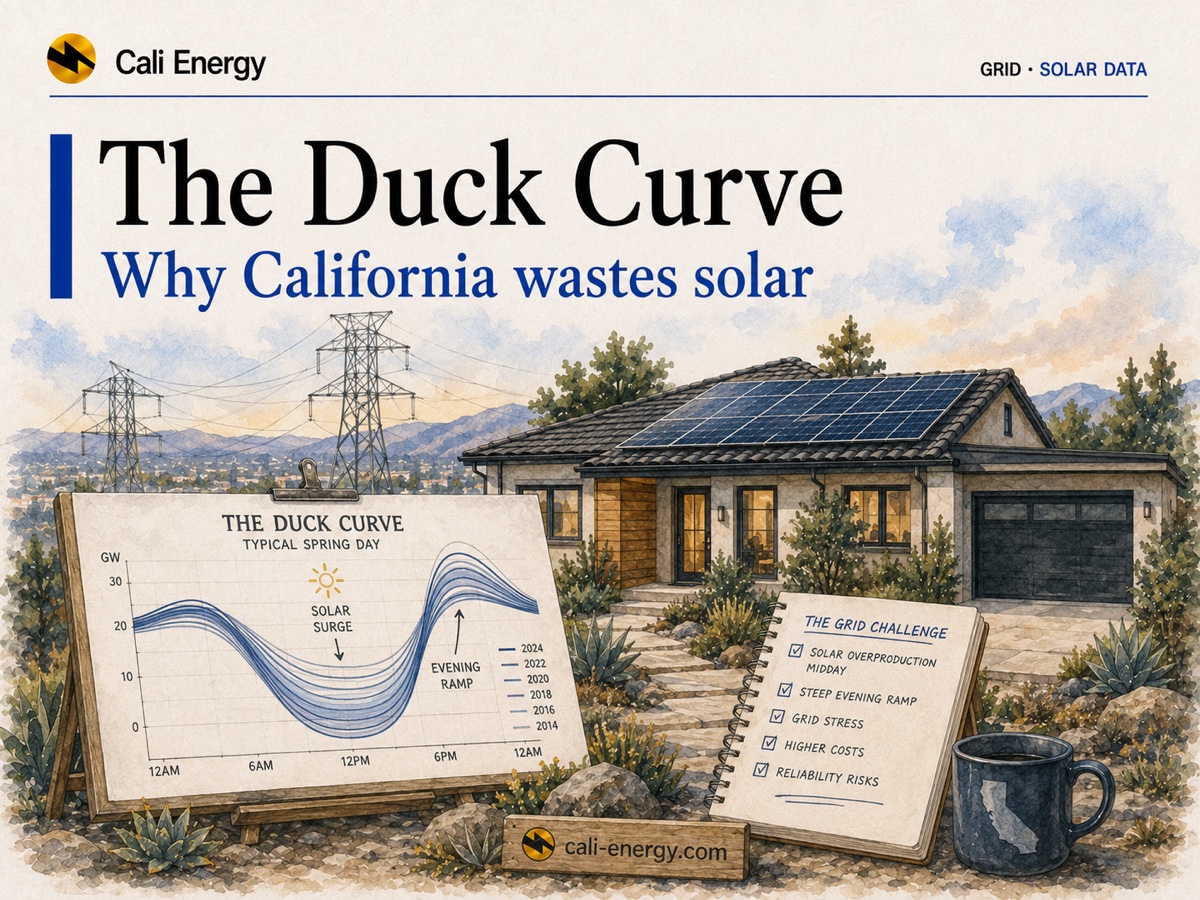
- Rising waste: CAISO curtailed 3.42 million MWh in 2024, 3.77 million in 2025 and 4.95 million in January–August 2026 alone. In 2024, 93% of it was solar.
- A spring problem: April 2026 alone saw 1.46 million MWh curtailed; November and December 2025 together saw under 60,000.
- Mostly congestion: in 2024, 92% of curtailment was local — lines without room to carry the power — and 8% statewide oversupply.
- The duck’s neck is getting steeper: the record three-hour evening ramp, 24,567 MW, came on March 16, 2026.
- For a homeowner: midday exports are worth little on SCE’s Solar Billing Plan; storing solar for the evening is worth more.
What is the duck curve?
Grid operators watch “net load”: electricity demand minus what wind and solar are producing. In California it sags in the middle of the day, when solar floods the grid, then climbs steeply in the late afternoon as the sun sets and people come home. Drawn over a day, the curve looks like a duck — the belly at midday, the neck in the evening — and as solar grows, the belly gets deeper (EIA). Rooftop solar is part of the picture: it lowers the demand the grid sees at midday.
The name comes from the grid operator itself. CAISO modeled net load for every day from 2012 to 2020 to see what California’s clean-energy goals would do to grid operations; the curves showed a midday “belly” and a fast evening rise like a duck’s neck, which became known as “the duck chart.” CAISO warned of three things: short, steep ramps, oversupply, and less automatic frequency response from conventional plants (CAISO Fast Facts). The curtailment and ramp records below show those warnings playing out.
Both ends are setting records. CAISO’s solar output peaked at 23,896 MW on August 19, 2026, and the steepest three-hour ramp on record, 24,567 MW, began at 3:50 p.m. on March 16, 2026; the second steepest was on October 5, 2025 (CAISO Key Statistics, August 2026). Something has to cover that evening climb — gas plants, imports, hydro and, more and more, batteries.
How much solar California throws away
Curtailment: telling solar and wind plants to produce less than they could.
| Period | MWh curtailed | Basis |
|---|---|---|
| 2024 | 3,423,377 | CAISO daily report, December 31, 2024 |
| 2025 | 3,766,065 | Sum of CAISO monthly totals |
| 2026, January–August | 4,948,794 | Sum of CAISO monthly totals |
Sources: CAISO curtailment report, December 31, 2024 · CAISO Key Statistics, December 2025 · CAISO Key Statistics, August 2026. CAISO stopped publishing daily curtailment reports after May 2025; the monthly totals for January–April 2025 match its last year-to-date figure, 2,289,988 MWh on April 30 (CAISO).
The 2024 figure matches the Energy Information Administration’s count of 3.4 million MWh, a 29% increase on 2023, with solar 93% of the total (EIA). These are utility-scale plants; home systems behind the meter are not curtailed this way.
Which months
Spring: strong sun, mild temperatures, low demand.
| Month | 2025 | 2026 |
|---|---|---|
| Jan | 130,267 | 26,572 |
| Feb | 502,516 | 242,714 |
| Mar | 919,020 | 774,415 |
| Apr | 738,184 | 1,460,005 |
| May | 451,683 | 1,448,995 |
| Jun | 253,672 | 600,081 |
| Jul | 145,471 | 241,073 |
| Aug | 130,117 | 154,939 |
| Sep | 179,640 | — |
| Oct | 256,407 | — |
| Nov | 28,933 | — |
| Dec | 30,155 | — |
Source: CAISO Key Statistics, December 2025 and August 2026, monthly curtailment charts.
March through May carry most of the year: in 2026 those three months alone curtailed 3.68 million MWh. In spring the sun is already strong while air-conditioning demand is still low, so at midday there is more power than the lines and the market can absorb; EIA notes the same spring peak in 2024 (EIA).
Mostly wires, not too much power statewide
CAISO curtails for two reasons: congestion, when transmission lines can’t carry the available energy, and oversupply, when generation exceeds demand across the system (EIA). In CAISO’s 2024 accounting, 3,152,255 MWh — 92% — was local curtailment and 271,122 MWh was system-wide (CAISO). More transmission and more storage both shrink it.
The fix the grid is building: batteries
Batteries charge on surplus midday solar and discharge into the evening ramp. Battery capacity on the CAISO grid grew from 8.0 GW in 2023 to 11.6 GW in 2024 (EIA), reached 15,810 MW by January 1, 2026 and 17,225 MW by September 2, 2026 (CAISO). Curtailment still rose, because solar grew faster and the spring surplus is concentrated in a few hours.
What it means for a home solar owner
Midday exports are cheap
On SCE’s Solar Billing Plan, a 2026 system earns about 6¢ for a summer-day export and about 21¢ for a summer-evening one (SCE). The duck curve is why.
Store it, use it later
A home battery does what the grid’s batteries do: moves midday solar into the evening; see do I need a battery.
Shift your own load
Run the pool pump, laundry and EV charging at midday on a time-of-use plan; see SCE time-of-use plans.
LADWP works differently
LADWP nets exports at retail prices, so the duck curve does not show up on its customers’ bills the same way; see LADWP net metering.
Where to go next
Cali Energy is a licensed Los Angeles solar, battery and electrical contractor (CSLB #1032379). We size solar and storage around when you use power, not only how much. Call +1-323-844-7777 or ask about solar with a battery.
Frequently asked
How much solar does California waste?
CAISO curtailed about 3.42 million MWh of wind and solar in 2024, 93% of it solar, and about 3.77 million in 2025. In January through August 2026 it curtailed 4.95 million MWh, about 51% more than in the same months of 2025.
What is the duck curve?
The shape of California’s net load — demand minus wind and solar — over a day: a deep dip at midday when solar floods the grid, then a steep climb in the late afternoon. The steepest three-hour climb on record, 24,567 MW, began at 3:50 p.m. on March 16, 2026.
What is the California duck curve in 2026?
Deeper than ever. Solar output set a record of 23,896 MW on August 19, 2026, the evening ramp set a record in March, and curtailment in the first eight months already exceeded all of 2025, peaking at 1.46 million MWh in April.
Why does NEM 3.0 pay so little for exported solar?
Export credits under the Net Billing Tariff follow the value of power hour by hour, and at midday the grid often has more solar than it can use. On SCE a 2026 system earns about 6¢ for a summer-day export and about 21¢ in the evening.
Does this mean solar isn’t worth it in California?
No. Solar the house uses itself still saves the full retail price; what changed is the value of exports. Sizing to your own use, shifting load to midday and adding a battery keep more of the value. LADWP customers still net exports at retail prices.
How does a battery help with the duck curve?
It charges on midday solar that would otherwise be exported cheaply or curtailed and discharges in the evening, when power is scarce and expensive. The CAISO grid had 17,225 MW of batteries by September 2026 doing exactly that.
Related reading
Sources & methodology
Figures on this page come from the primary sources below and, where noted, from Cali Energy calculations using the stated assumptions. Rates, incentives, and program terms change; each was verified October 5, 2026.
- CAISO — Wind and Solar Curtailment report, December 31, 2024 (year-to-date totals by type)
- CAISO — Key Statistics, December 2025 (monthly curtailment 2025, installed batteries)
- CAISO — Key Statistics, August 2026 (monthly curtailment 2026, records, installed batteries)
- CAISO — Daily wind and solar curtailment reports (library)
- EIA — Solar and wind curtailments are increasing in California (May 28, 2025)
- EIA — As solar capacity grows, duck curves are getting deeper in California
- SCE — How the Solar Billing Plan works (export values by start year)
- CAISO — Fast Facts: What the duck curve tells us about managing a green grid (2016)
Turn wasted midday sun into evening power
Tell us your utility and when your household uses power, and we’ll size solar and storage around it. Estimates, not guarantees.
Get a free estimatePrepared by Cali Energy, October 5, 2026. This article is for general educational purposes only and is not legal, tax, financial, engineering, or utility advice. Rates, incentives, codes, permit requirements, equipment specifications, prices, and program terms may change; figures and timelines are estimates, not guarantees. Confirm current requirements with the applicable utility, AHJ, program administrator, manufacturer, or a licensed professional. See our Content Disclaimer. Cali Energy · 19201 Parthenia St, Unit E, Northridge, CA 91324 · CSLB #1032379 (B, C-10, C-39)